Odoo>Excel Vs. Odoo Dynamic Reports: Which is Best For Your Business?
Excel Vs. Odoo Dynamic Reports: Which is Best For Your Business?
Odoo
5 MIN READ
October 17, 2025
In today’s data-driven world, businesses rely on robust reporting tools to make informed decisions, track performance, and uncover insights. Two popular options often come up in discussions: Microsoft Excel, a staple in offices worldwide, and Odoo Dynamic Reports, part of the versatile Odoo ERP system. But which one is truly best for your business? In this blog, we’ll dive deep into a head-to-head comparison, exploring their features, strengths, limitations, and ideal use cases, while highlighting how Dashboard Ninja with AI can elevate your Odoo reporting experience. Whether you’re a small startup or a growing enterprise, understanding these tools can help you choose the right one to streamline your operations.
Understanding Microsoft Excel for Business Reporting
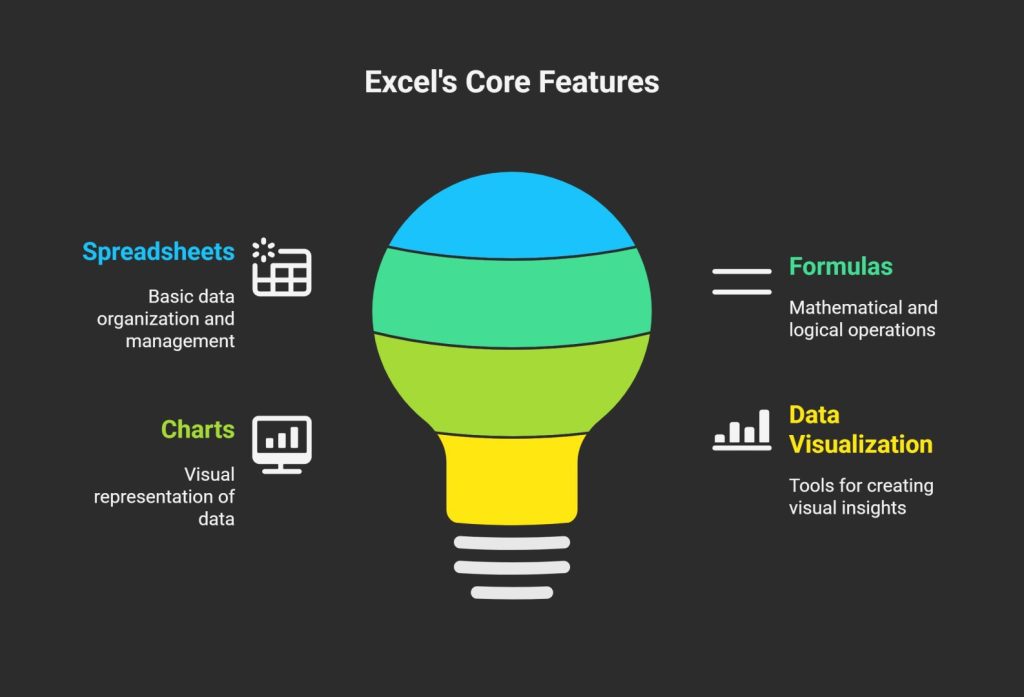
Microsoft Excel has been around since 1985 and remains one of the most widely used tools for data analysis and reporting. It’s part of the Microsoft 365 suite and excels at handling spreadsheets, formulas, charts, and basic data visualization.
Pros of Excel:
Ease of Use and Accessibility: Excel’s interface is intuitive for most users, especially those familiar with spreadsheets. You can quickly create reports, pivot tables, and charts without needing advanced technical skills. It’s available on desktop, web, and mobile, making it highly accessible.
Flexibility: With powerful features like VBA scripting, conditional formatting, and add-ins (e.g., Power Query for data import), Excel allows for custom formulas and automation. It’s great for ad-hoc analysis where you need to manipulate data on the fly.
Cost-Effective for Basics: Many businesses already have Microsoft 365 subscriptions, so there’s no additional cost. Free alternatives like Google Sheets offer similar functionality.
Offline Capabilities: Work on reports without an internet connection, which is ideal for field teams or areas with unreliable connectivity.
Cons of Excel:
Scalability Issues: As datasets grow (beyond a few thousand rows), Excel can become slow, prone to crashes, and difficult to manage. Sharing large files via email often leads to version control problems.
Limited Collaboration: Real-time collaboration is possible via OneDrive, but it’s not seamless for large teams. Multiple users editing the same file can cause conflicts.
Security and Data Integrity: Excel files are vulnerable to human error (e.g., accidental formula changes) and lack built-in audit trails. Sensitive data isn’t as secure as in enterprise systems.
Static Nature: Reports are often manual; updating data requires re-importing or refreshing, which isn’t ideal for dynamic, real-time business intelligence.
Excel shines for small-scale, one-off reports or personal use but struggles in complex, multi-user environments.
Exploring Odoo Dynamic Reports
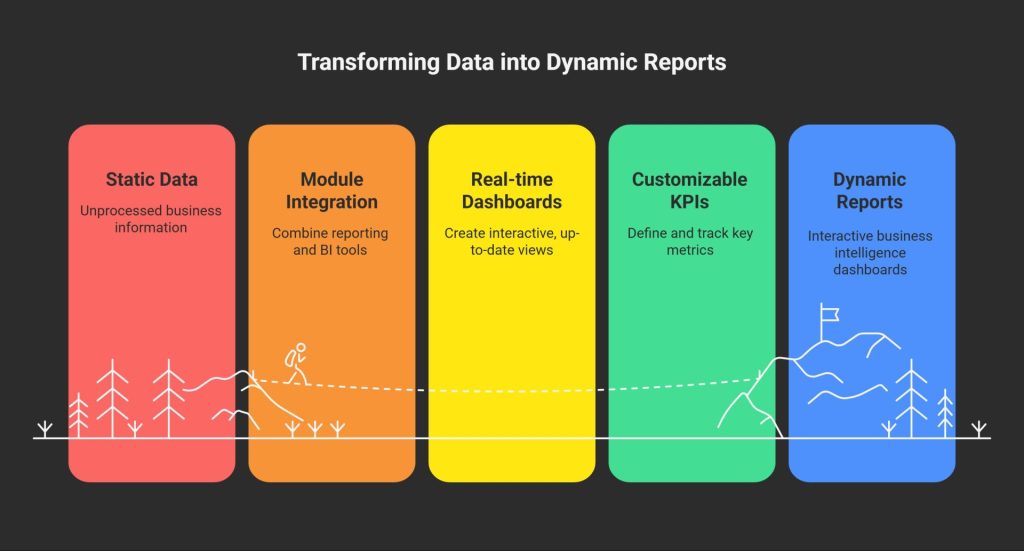
Odoo is an open-source ERP platform that integrates various business functions like CRM, inventory, accounting, and more. Its Dynamic Reports feature leverages modules like the Reporting and Business Intelligence tools to create interactive, real-time dashboards and reports. These include pivot views, graphs, Kanban boards, and customizable KPIs that pull data directly from your Odoo database.
Pros of Odoo Dynamic Reports:
Real-Time Data and Automation: Reports update automatically as data changes in the system, eliminating manual refreshes. This is perfect for monitoring live metrics like sales pipelines or inventory levels.
Integration and Scalability: Odoo seamlessly connects with other modules (e.g., linking sales data to financial reports). It handles large datasets efficiently, scaling with your business growth without performance dips.
Collaboration and Customization: Multi-user access with role-based permissions ensures secure teamwork. You can build custom reports using drag-and-drop builders, filters, and advanced visualizations like heat maps or cohort analysis.
Cost Efficiency for Enterprises: The community edition is free, while the enterprise version offers premium features at a subscription model. It’s often more affordable long-term than licensing multiple tools.
Advanced Analytics: Built-in support for forecasting, trend analysis, and exporting to formats like PDF or Excel. Mobile apps allow on-the-go access.
Cons of Odoo Dynamic Reports:
Learning Curve: New users might find the interface overwhelming compared to Excel’s simplicity, especially if not tech-savvy. Setting up requires some configuration.
Dependency on Odoo Ecosystem: It’s most effective within Odoo; integrating external data sources can require additional modules or development.
Initial Setup Costs: While the software is free/open-source, implementation might involve hiring developers or consultants for customization.
Limited Offline Access: Primarily cloud-based, so it needs internet connectivity for full functionality.
Odoo Dynamic Reports are designed for businesses seeking integrated, automated insights rather than isolated spreadsheets.
Direct Comparison: Key Factors to Consider
To help you decide, let’s compare Excel and Odoo Dynamic Reports across critical dimensions:
Feature/Aspect
Microsoft Excel
Odoo Dynamic Reports
Data Handling
Best for small to medium datasets; manual imports
Handles large, real-time data from integrated sources
Customization
High with formulas and add-ins
High with drag-and-drop, modules, and API integrations
Collaboration
Basic real-time via cloud; version issues
Advanced with permissions and live updates
Scalability
Limited; slows with growth
Excellent; built for enterprise-level use
Cost
Low (if subscribed); per-user licensing
Free community version; paid for advanced features
Security
File-based; prone to errors
Database-level with audits and encryption
Automation
VBA scripts; manual triggers
Fully automated with workflows
Visualization
Charts, pivot tables
Interactive dashboards, graphs, KPIs
Best For
Quick, personal analysis
Business-wide, dynamic reporting
In summary, Excel is like a Swiss Army knife—versatile but not specialized for heavy-duty tasks. Odoo Dynamic Reports act as a full toolkit, integrated and powerful for ongoing business needs.
When to Choose Excel vs. Odoo Dynamic Reports
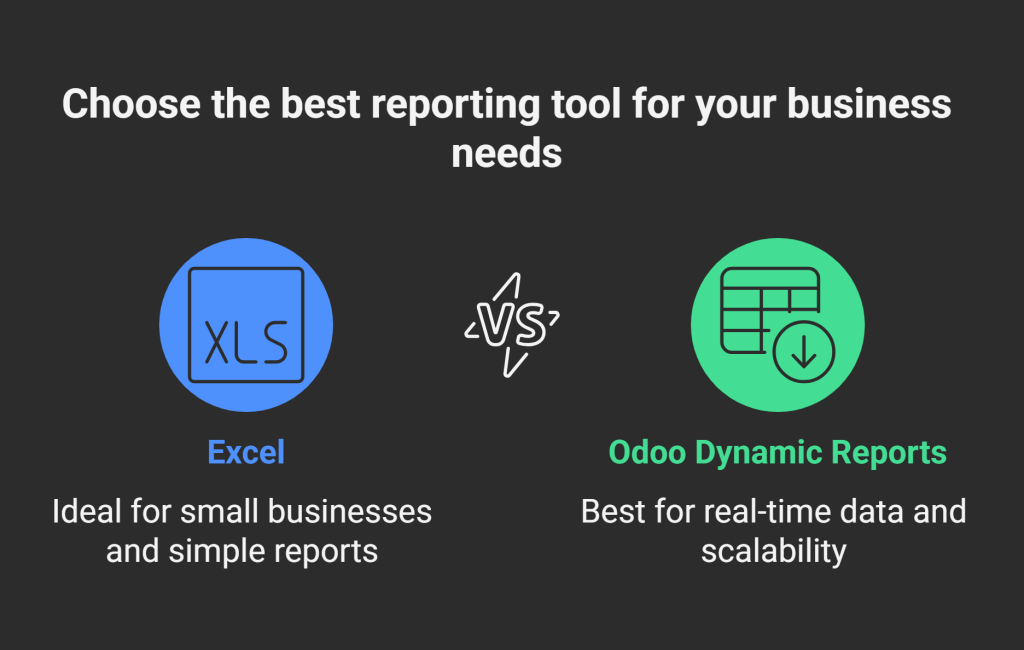
Choose Excel if: Your business is small, reports are infrequent, or you need something simple and familiar. It’s ideal for freelancers, startups in early stages, or when budget constraints limit ERP adoption.
Choose Odoo Dynamic Reports if: You require real-time insights, handle complex data from multiple departments, or aim for scalability. It’s suited for mid-sized to large businesses in e-commerce, manufacturing, or services where integration is key.
Hybrid Approach: Many businesses use both—Excel for quick exports and ad-hoc tweaks, while Odoo handles the core reporting.
Supercharge Your Odoo Reports with Dashboard Ninja with AI
If you’re leaning towards Odoo Dynamic Reports, you can take your reporting to the next level with Dashboard Ninja with AI, a premium Odoo app developed by Ksolves. This tool enhances Odoo’s reporting capabilities with cutting-edge AI features, making it a standout choice for businesses seeking intelligent, user-friendly dashboards. Here are some key features that make Dashboard Ninja with AI a game-changer:
AI-Powered Dashboard Creation: Automatically generate entire dashboards or individual items by selecting a model or entering keywords. The AI analyzes your data and suggests optimal layouts and visualizations, saving time and effort.
17+ Visualization Options: Choose from an impressive range of charts, including Bar, Line, Pie, Doughnut, Flower, Funnel, Radial, Radar, Scatter, Bullet, and Map views, to present data in visually stunning ways.
Real-Time Streaming Dashboards: Monitor live data feeds for immediate insights into sales, inventory, CRM, or other metrics, ensuring you’re always working with up-to-date information.
Multi-Company Support: Visualize data from different companies within a single dashboard, ideal for businesses with complex structures.
Advanced Filtering and Grouping: Utilize advanced date filters, predefined filters, or custom options to organize data by time periods, customer segments, or product types for deeper insights.
Granular Access Control: Manage user permissions to ensure only authorized personnel can view or edit dashboards, enhancing data security.
Export and Import Capabilities: Export dashboards or items to Excel, CSV, PDF, or PNG formats, and import dashboards across Odoo instances for seamless collaboration.
TV Mode for Presentations: Display dashboards on large screens for office presentations or meetings, with a Play button to rotate items at set intervals.
SQL Query Support (Advanced Version): Combine data from multiple models using custom SQL queries to create complex dashboard items, such as cross-model calculations.
Mobile Compatibility: Optimized for mobile devices, ensuring you can track KPIs on the go with a fluid, responsive layout.
Seamless Collaboration: Dedicated communication channels for each dashboard item allow real-time discussions, ensuring clarity and transparency in decision-making.
Bookmarking and Quick Edit Mode: Bookmark important dashboards and edit items instantly without navigating complex menus, boosting productivity.
These features make Dashboard Ninja with AI a powerful addition to Odoo, offering unmatched flexibility and intelligence compared to standard Odoo Dynamic Reports or Excel. Plus, all AI features are included free after purchasing the module, and it’s compatible with both Odoo Community and Enterprise editions.
Ready to revolutionize your reporting?
Contact us at sales@ksolves.com or visit the Odoo App Store to explore Dashboard Ninja with AI and unlock the full potential of your Odoo ERP today!
Choosing between Excel and Odoo Dynamic Reports depends on your business’s size, complexity, and goals. Excel is a quick, accessible choice for small-scale, manual reporting, but it falls short in scalability and automation. Odoo Dynamic Reports, enhanced by tools like Dashboard Ninja with AI, offer a robust, integrated solution for businesses needing real-time, scalable, and collaborative insights.
With its AI-driven automation, diverse visualization options, and seamless Odoo integration, Dashboard Ninja with AI empowers you to transform raw data into actionable intelligence effortlessly. Whether you’re tracking sales trends, inventory levels, or KPIs, this tool ensures you stay ahead in a competitive landscape.