

Odoo Live Server Insights
SysVitals
Odoo Live Server Insights
Real-time CPU, RAM, swap, disk, network and process monitoring, plus a live Odoo log stream, PostgreSQL database insights, threshold alerts, slow-operation tracking and login brute-force detection. Everything runs inside the Odoo backend, with no SSH or server console access required.





Live Dashboard
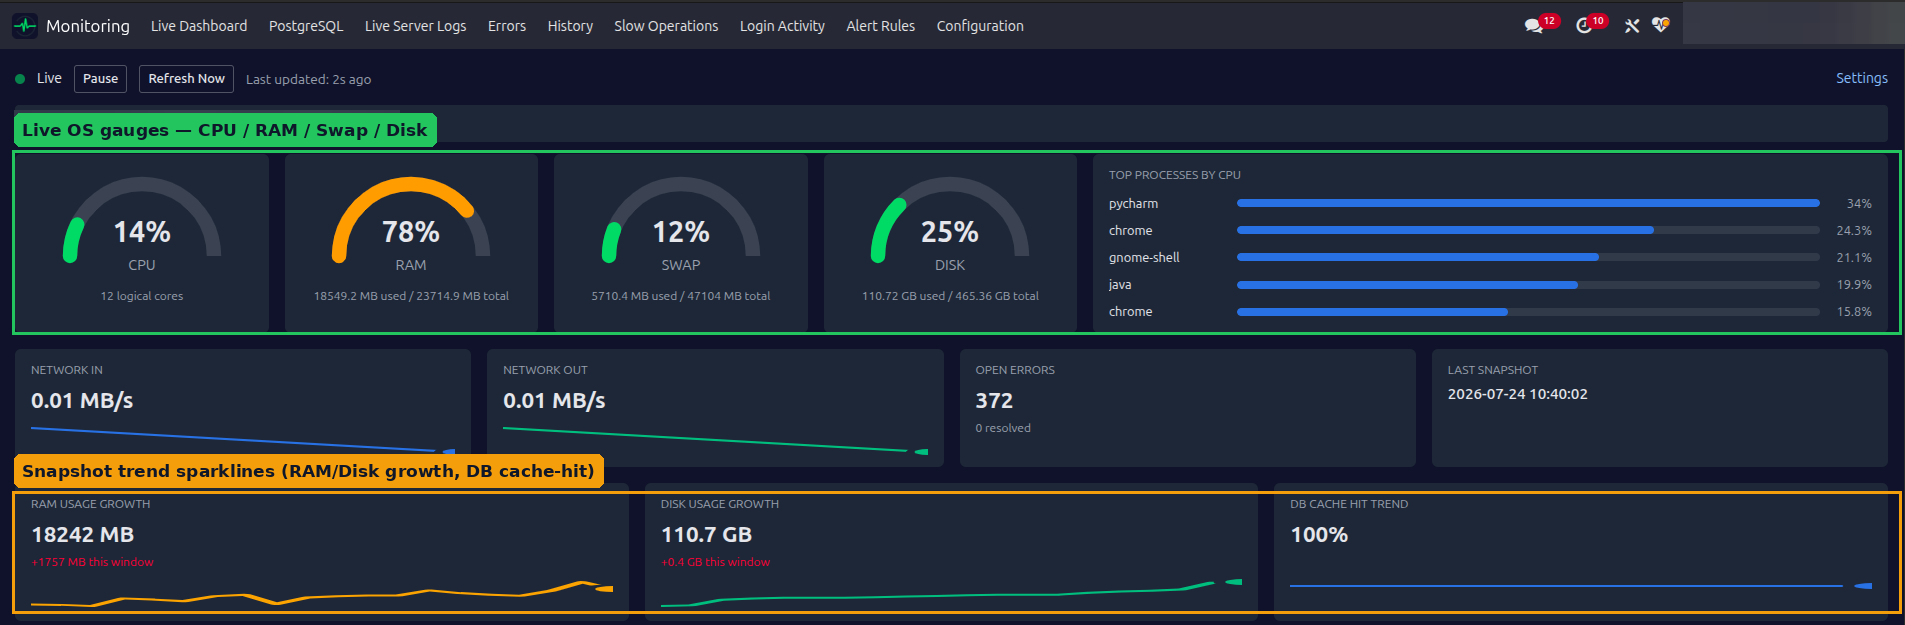
A single glance at host health: live CPU, RAM, swap and disk gauges alongside top processes, network throughput and historical trends.
-
Live CPU / RAM / Swap / Disk gauges, refreshed every few seconds
-
-
-
-


Live Server Logs
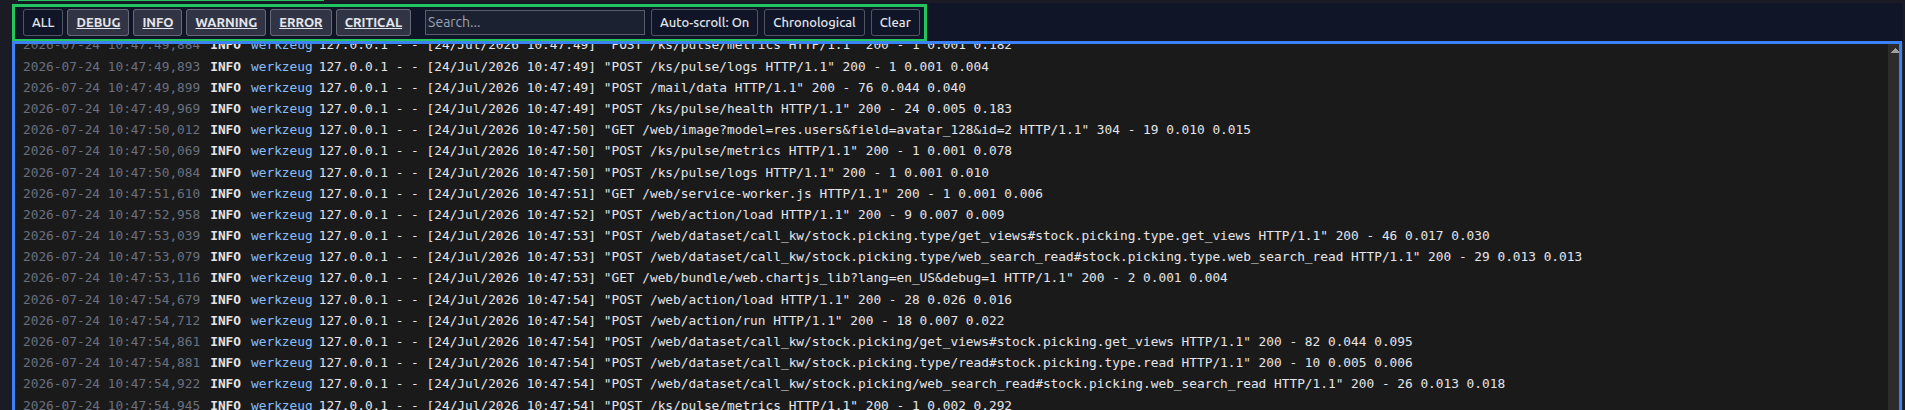
Tail your Odoo log file in real time, right from the browser, with instant level filtering and keyword search.
-
-
-
-


Tracked Server Errors
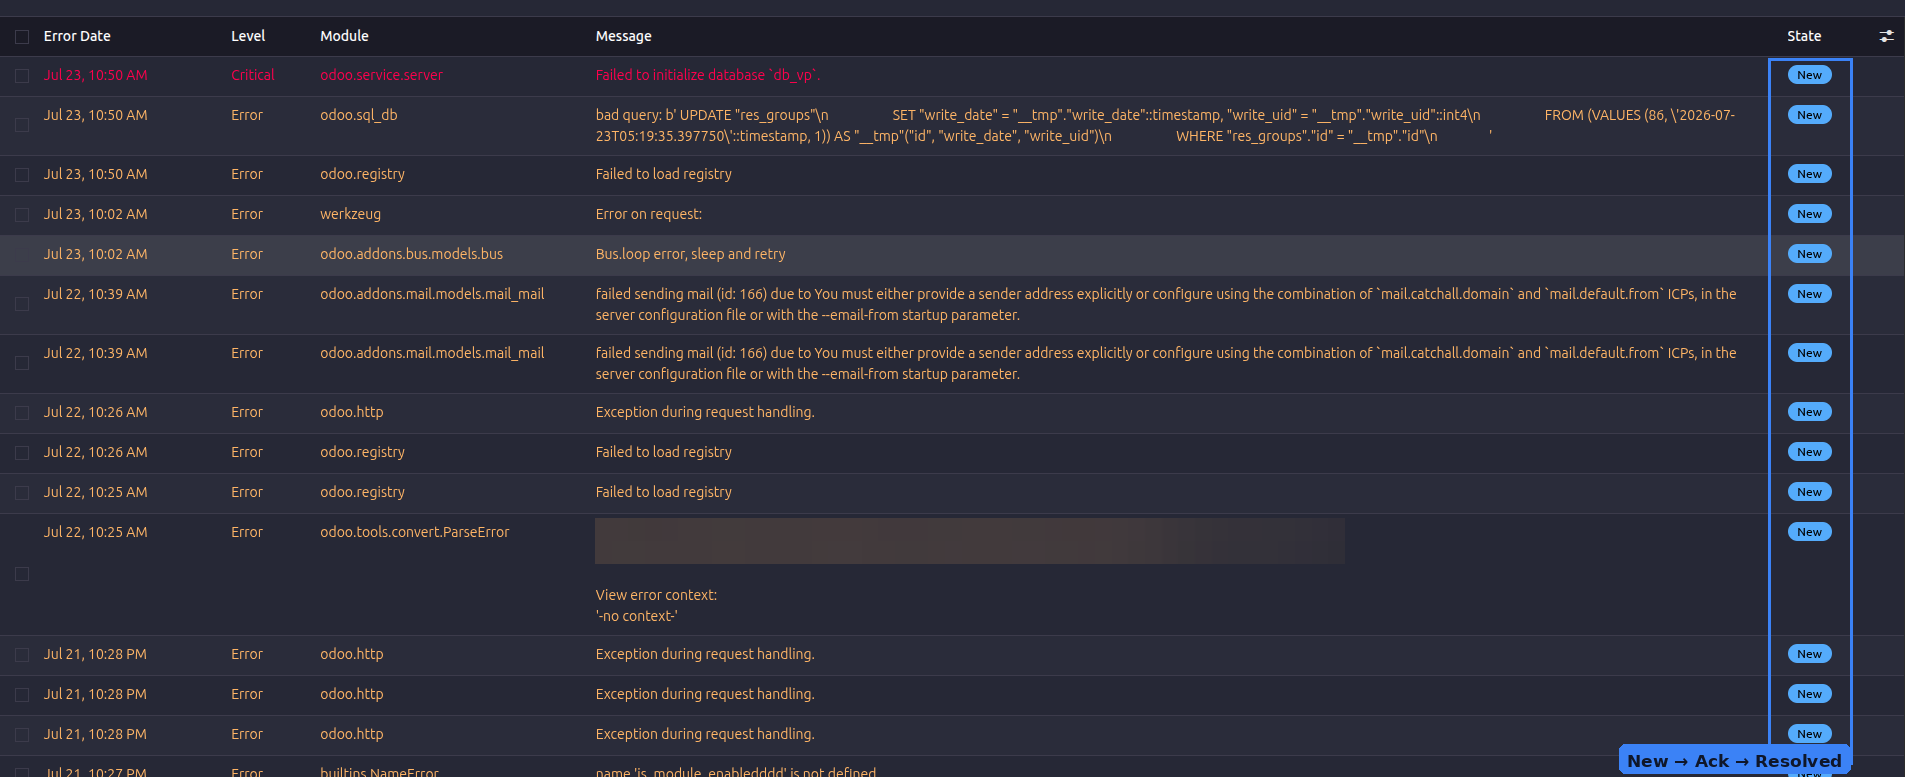
Every ERROR and CRITICAL line is automatically captured, deduplicated and tracked through a proper resolution workflow.
-
-
-
-


PostgreSQL Monitor
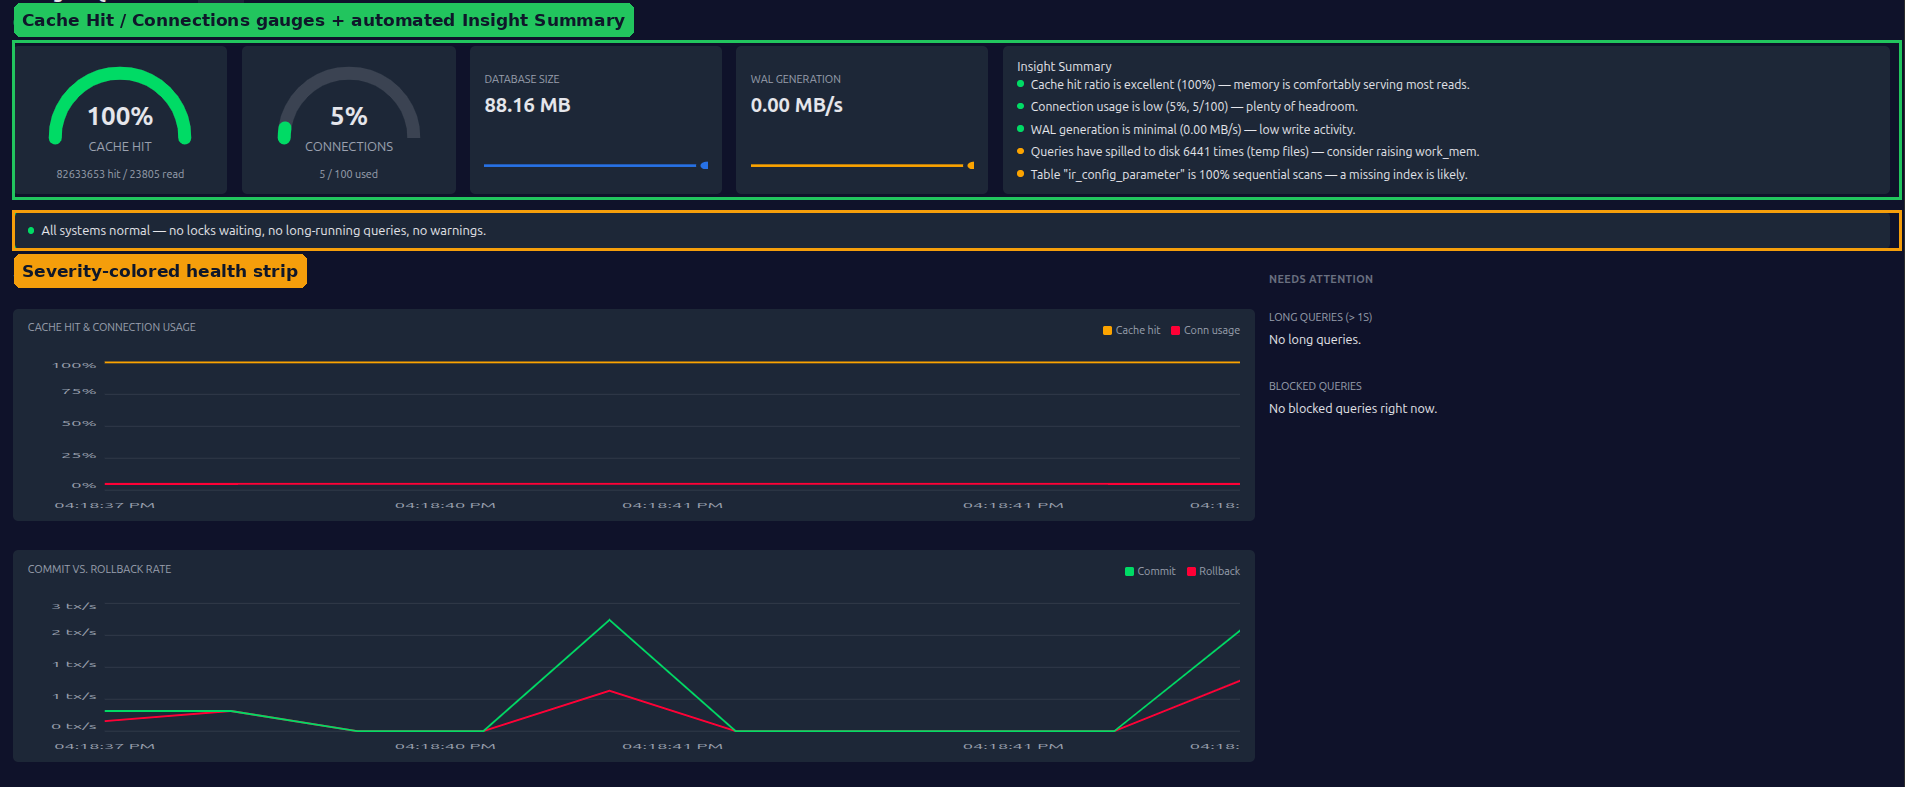
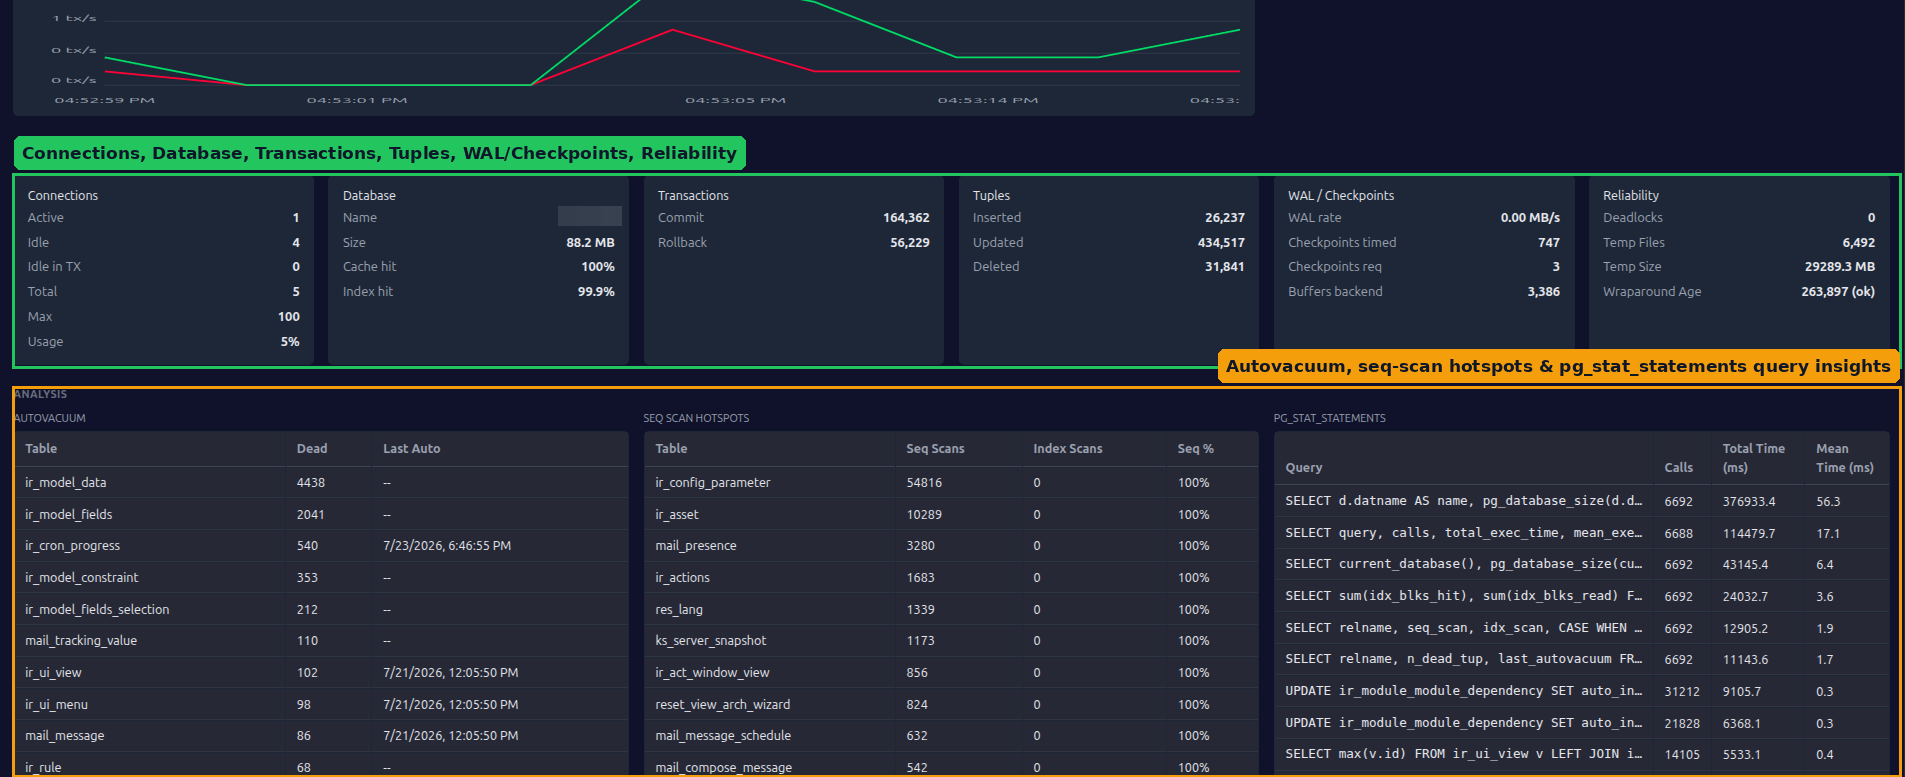
A dedicated health view for your database: connections, cache efficiency, locks, slow queries and autovacuum, all in one place.
-
-
-
-
-
-


Threshold Alerts
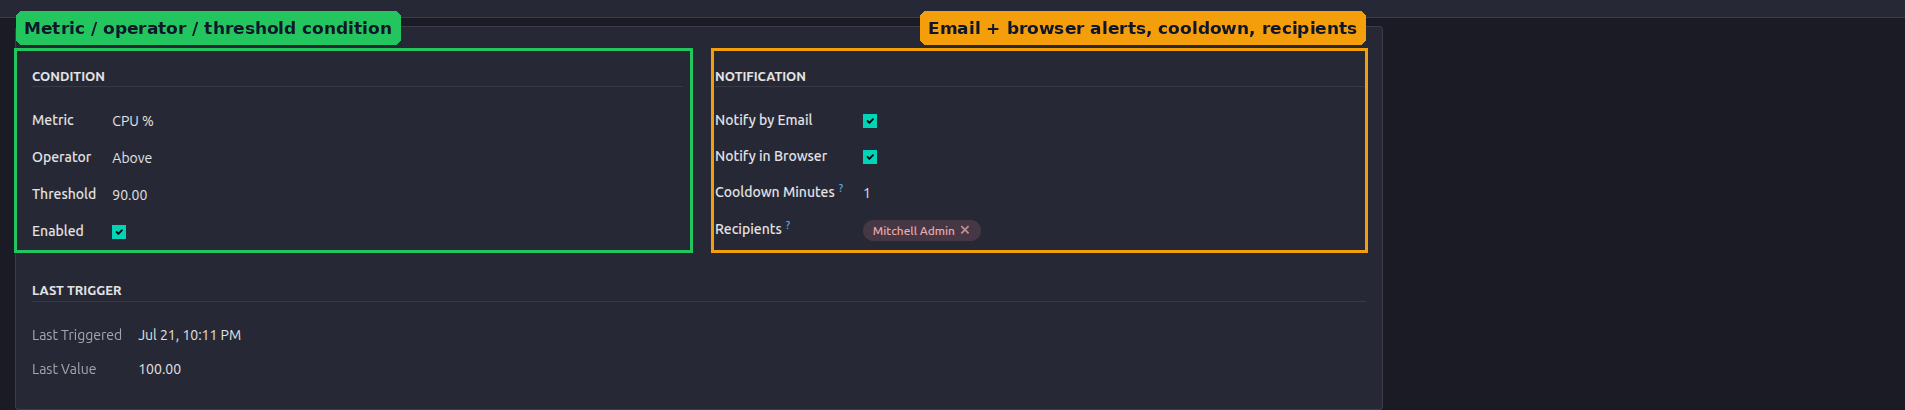
Define your own limits for any metric and get notified the moment something crosses the line, before it becomes an incident.
-
-
-
-


Login Activity & Brute-Force Detection
Every login attempt is logged and aggregated, with automatic alerts when failed attempts for a user cross a configurable threshold.
-
-
-
-



Global Systray Health Widget
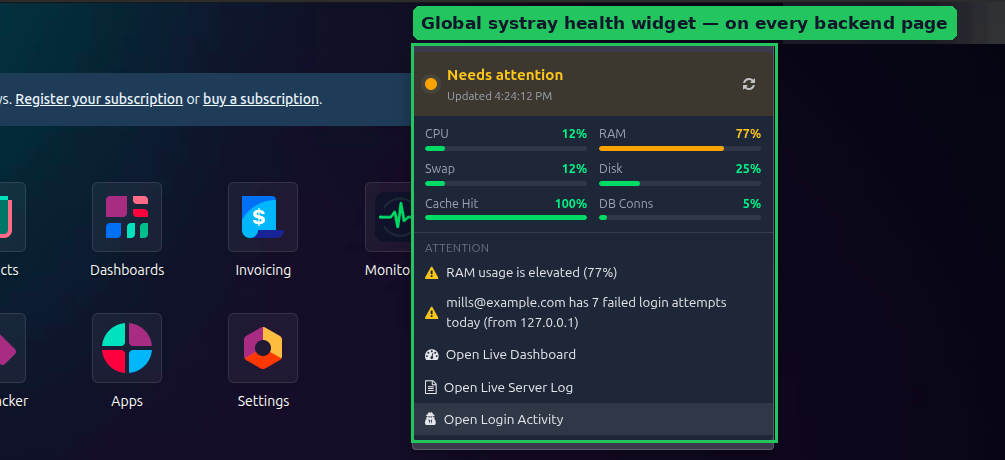
A color-coded pulse icon in the systray keeps server health visible from anywhere in the Odoo backend, not just the dashboard.
-
-
-
-


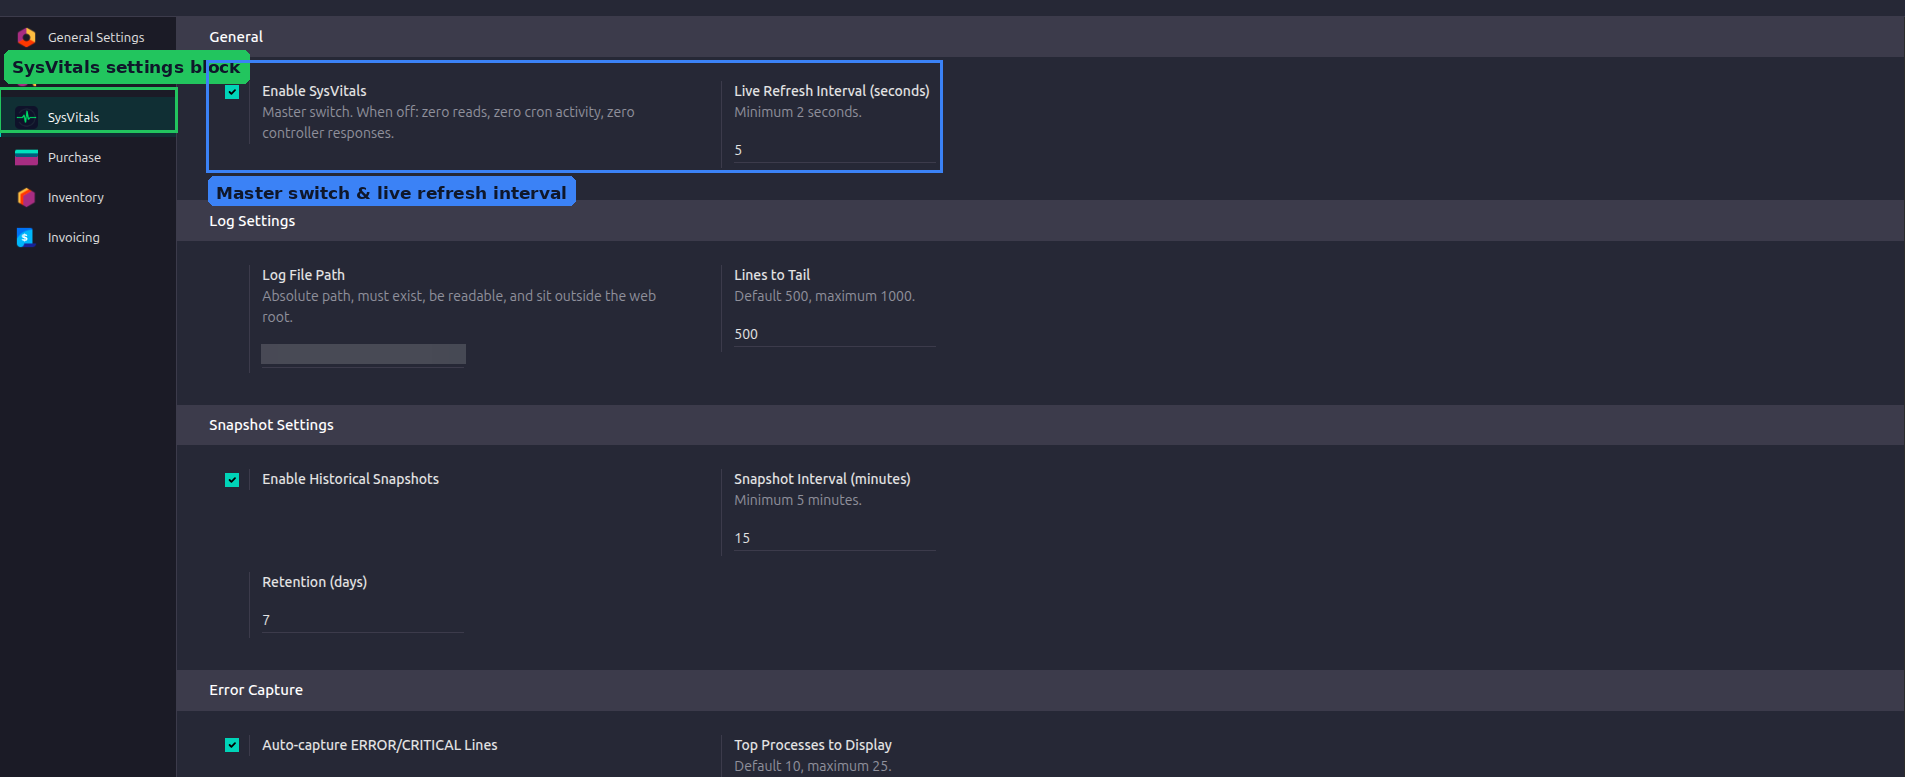
Configuration
Fine-tune every aspect of SysVitals (refresh intervals, retention, thresholds and access) from one dedicated settings screen.
-
-
-
-

Free 90 Days Support
Ksolves provides free 90 days support for any doubt, queries and bug fixing (excluding data recovery) or any type of issues related to this module. This is applicable from the date of purchase.
Why Ksolves
You know us as the makers of Dashboard Ninja. You will remember us for SysVitals.
Your trusted partner in offering tailored solutions for your unique business vision.


Share your specific business requirements or challenges with us, and let us craft a custom solution that meets your needs.
Get in Touch


Why Choose Ksolves for SysVitals

Frequently Asked Questions

psutil and file tailing, and shown entirely inside the Odoo backend UI.
pg_monitor) simply degrades to "unavailable" instead of breaking the rest of the page or the request's transaction.
pg_stat_statements extension is already installed at the Postgres level; otherwise it shows a clear "not installed" message.
Release Notes
-
19.0.1.0.0 New Version Released | 24 August 2026
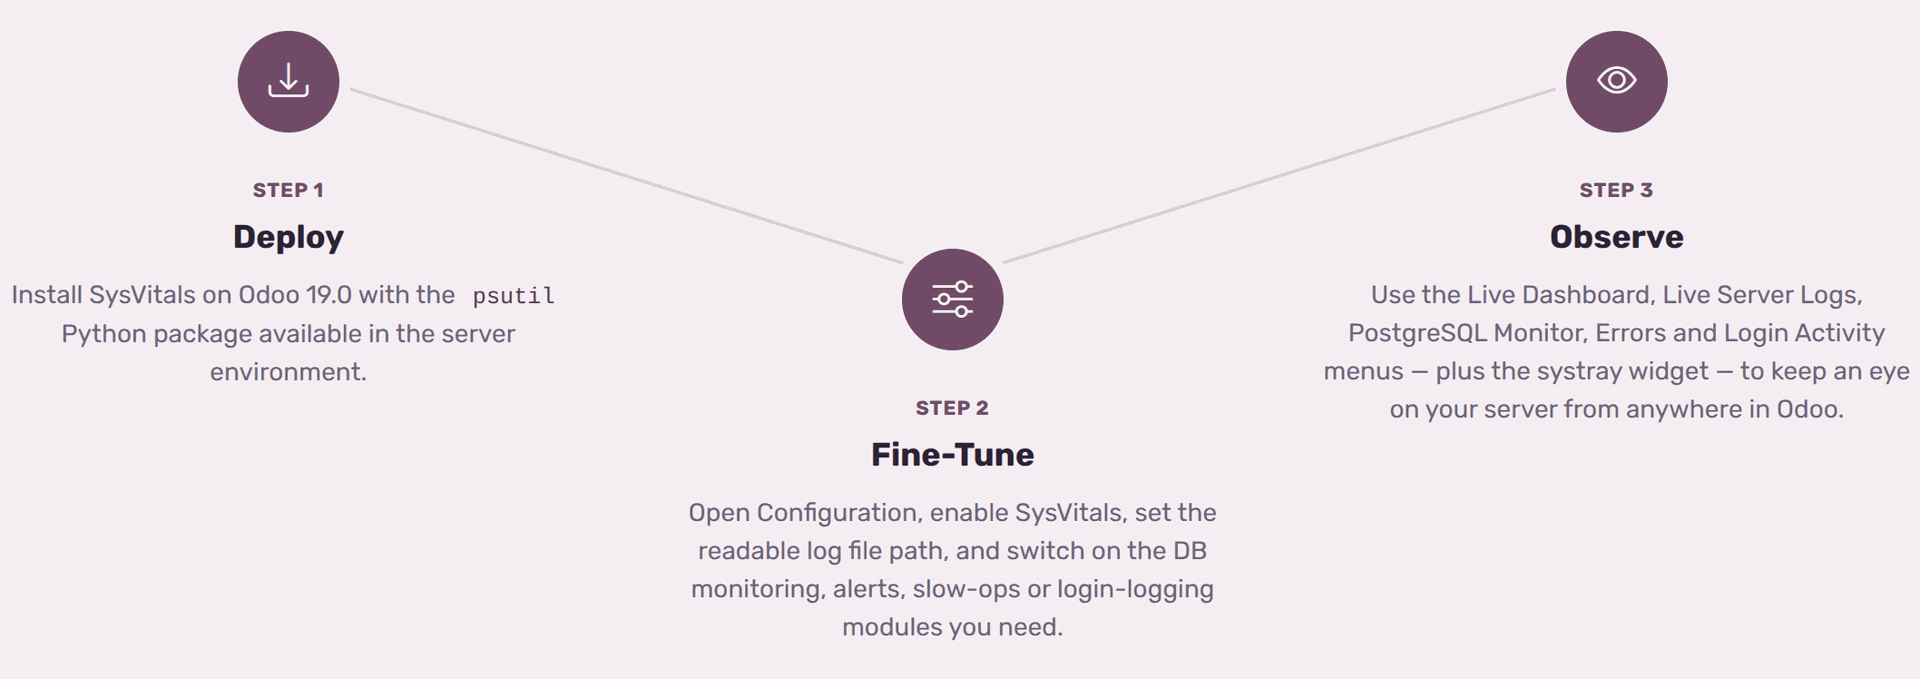
Install SysVitals on Odoo 19.0 with the psutil Python package available in the server environment.
Open Configuration, enable SysVitals, set the readable log file path, and switch on the DB monitoring, alerts, slow-ops or login-logging modules you need.
Use the Live Dashboard, Live Server Logs, PostgreSQL Monitor, Errors and Login Activity menus (plus the systray widget) to keep an eye on your server from anywhere in Odoo.


Install SysVitals on Odoo 19.0 with the psutil Python package available in the server environment.

Open Configuration, enable SysVitals, set the readable log file path, and switch on the DB monitoring, alerts, slow-ops or login-logging modules you need.

Use the Live Dashboard, Live Server Logs, PostgreSQL Monitor, Errors and Login Activity menus (plus the systray widget) to keep an eye on your server from anywhere in Odoo.
Requirements
 Requirements
SysVitals runs inside the Odoo process itself, so it needs local access to the host it's running on.
 Odoo 19.0, Community or Enterprise
Python package
Odoo 19.0, Community or Enterprise
Python package psutil
Readable log file on the host
Admin access (base.group_system) for setup
Ideal For
 Ideal For
Self-hosted teams: running and owning their own Odoo server, on-premise or on a VPS.

Security-conscious admins: want server & database visibility without opening up SSH.

Lean ops teams: would rather not stand up a separate monitoring stack.

Heads up: managed/sandboxed hosting may restrict host-level metrics or log access, so check with your provider first.

Free 120 Days Support
Get 120 days of FREE support (doubt, queries,
& bug fixing)
on Odoo
applications from the date of purchase. Enhance the functionality of
your business with the Ksolves Odoo experts.
