
pic
SysVitals — Odoo Live Server Insights
120 Days
Free Support
Free
Lifetime Update
Free
Installation

SysVitals — Odoo Live Server Insights

Ksolves SaaS Lite


Supported Versions

All the compatible versions

10.00 € 10.0 EUR

10.00 €
Installation: Free
Support Period for 4 Months: Free

Live Demo
120 Days
Free Support
Free
Lifetime Update
Free
Installation
Odoo 19.0
Live server & log monitoring: CPU, RAM, Disk, PostgreSQL, alerts and login security, right inside the Odoo UI.
SysVitals logo
SysVitals
Odoo Live Server Insights
sales@ksolves.com
SysVitals icon

SysVitals

Odoo Live Server Insights

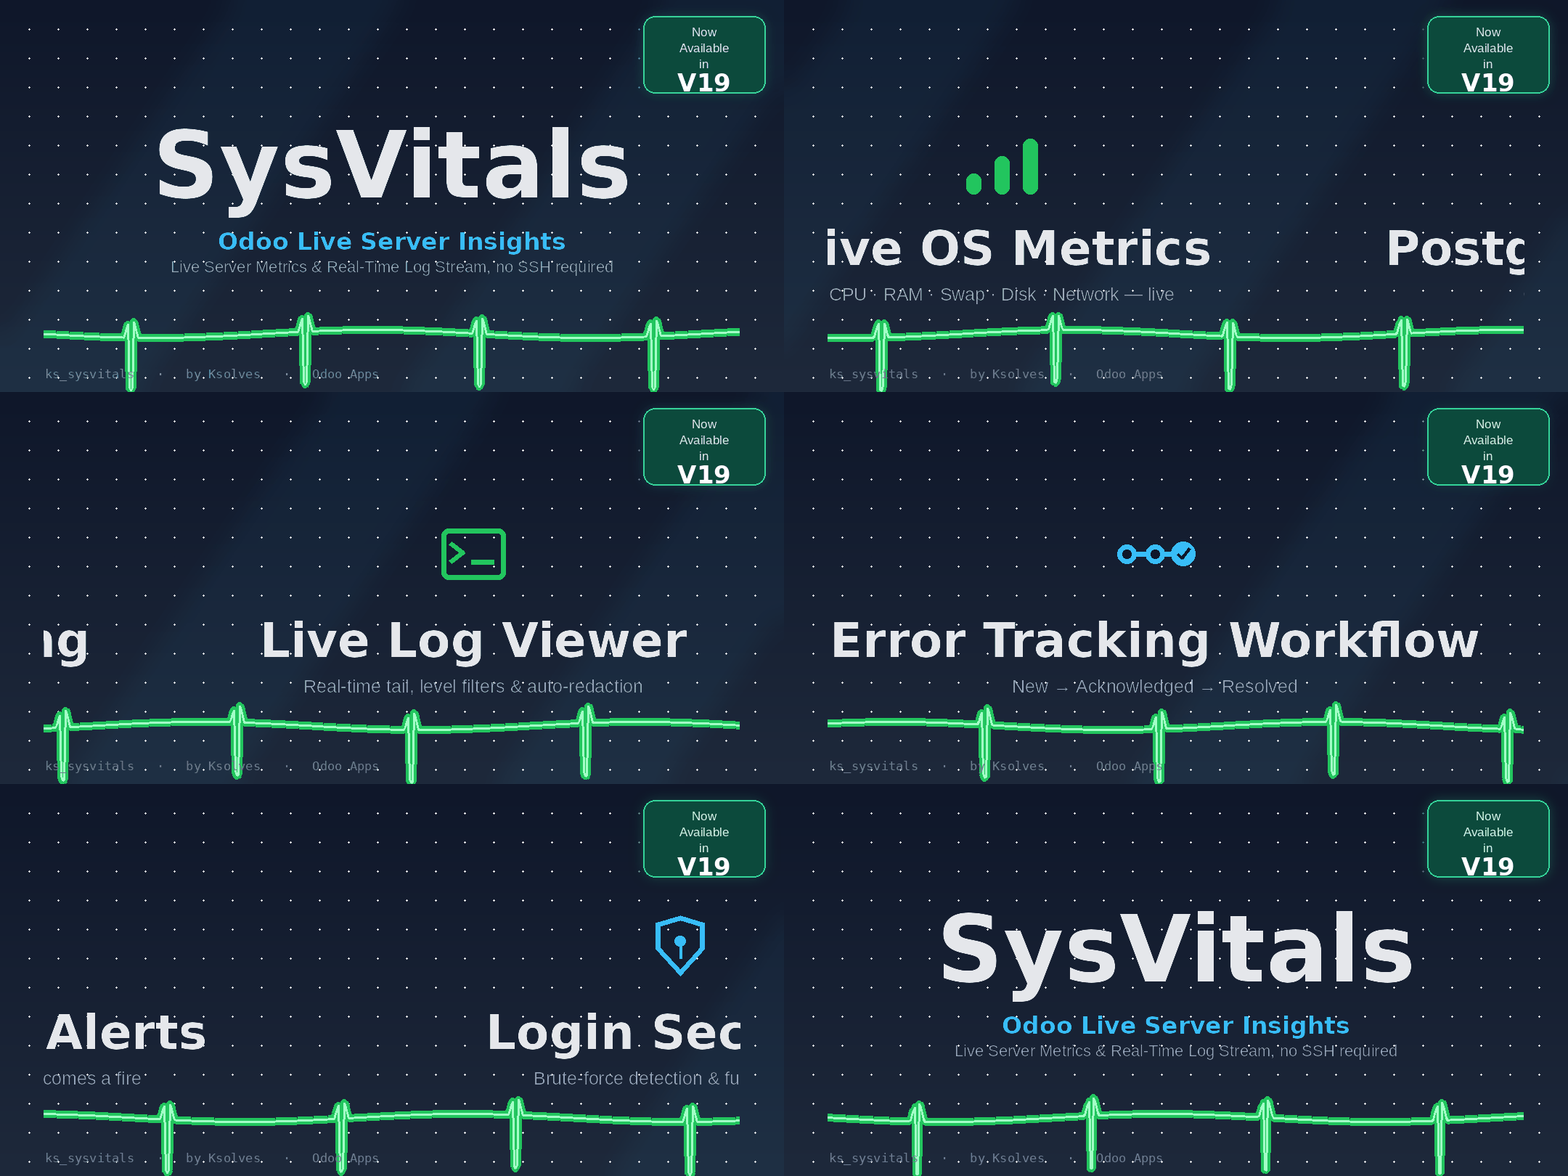
Real-time CPU, RAM, swap, disk, network and process monitoring, plus a live Odoo log stream, PostgreSQL database insights, threshold alerts, slow-operation tracking and login brute-force detection. Everything runs inside the Odoo backend, with no SSH or server console access required.


Powered by Ksolves Odoo Gold Partner CMMI Level 3
Odoo Community, Enterprise & odoo.sh
What's inside
Key Highlights
01
heightlights icon
Non-blocking live CPU/RAM/Swap/Disk gauges
02
heightlights icon
Real-time, sanitized log streaming with filters & search
03
heightlights icon
Automatic error capture with full traceback & workflow
04
heightlights icon
PostgreSQL health: cache hit, locks & query insights
05
heightlights icon
Configurable threshold alerts: email & in-app
06
heightlights icon
Login brute-force detection & escalating alerts
07
heightlights icon
Global systray health widget on every backend page
08
heightlights icon
Two dedicated security groups, safe by default
heightlights icon

Live Dashboard

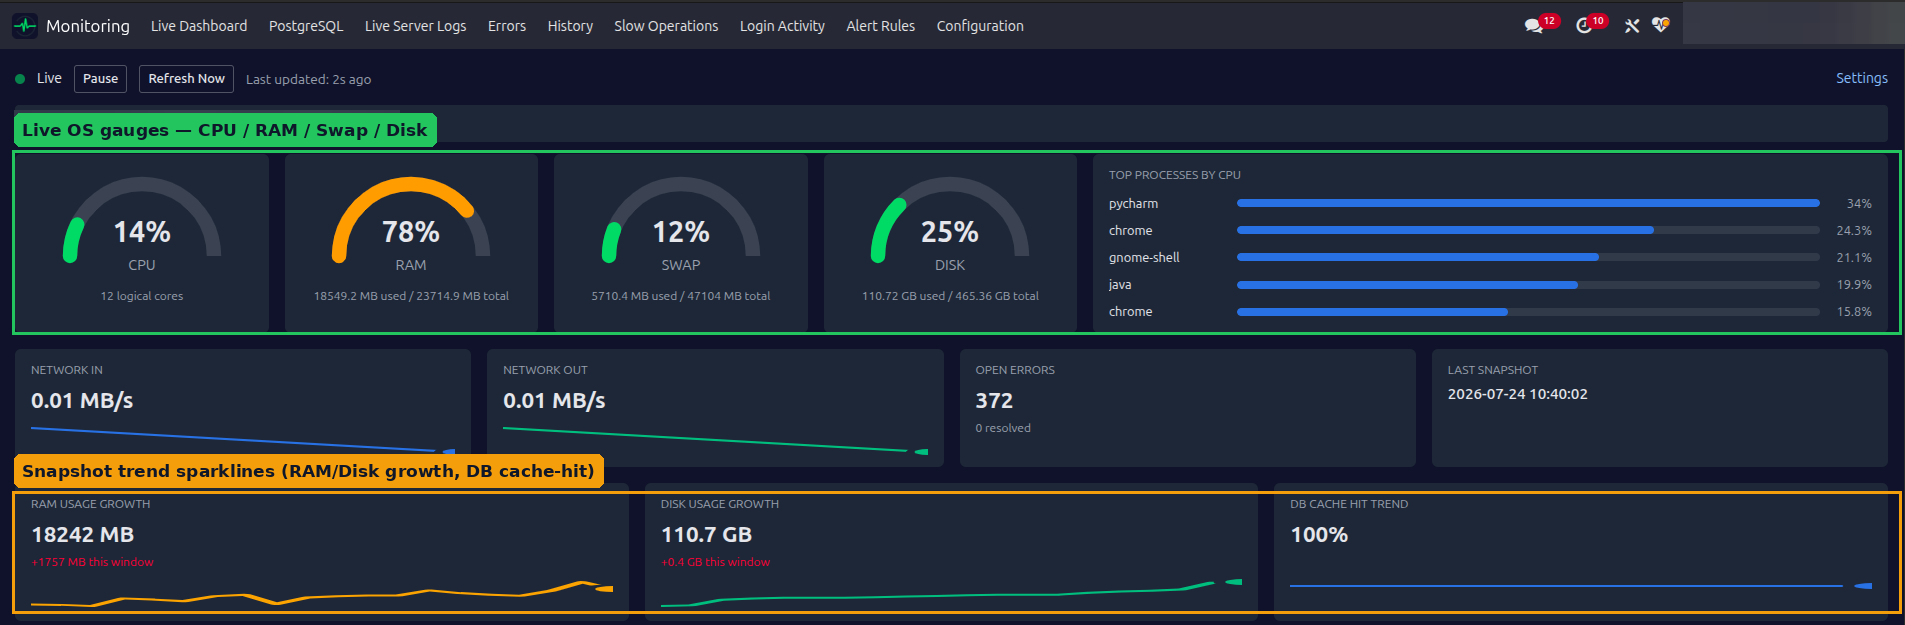
A single glance at host health: live CPU, RAM, swap and disk gauges alongside top processes, network throughput and historical trends.

  • arrow icon Live CPU / RAM / Swap / Disk gauges, refreshed every few seconds
  • arrow icon Top processes by CPU, sortable, with threshold highlighting
  • arrow icon Network throughput rate with rolling history
  • arrow icon Open-error count & last-snapshot insights, refreshed independently
  • arrow icon Trend row: RAM/Disk usage growth & DB cache-hit trend sparklines
SysVitals Live Dashboard
heightlights icon

Live Server Logs

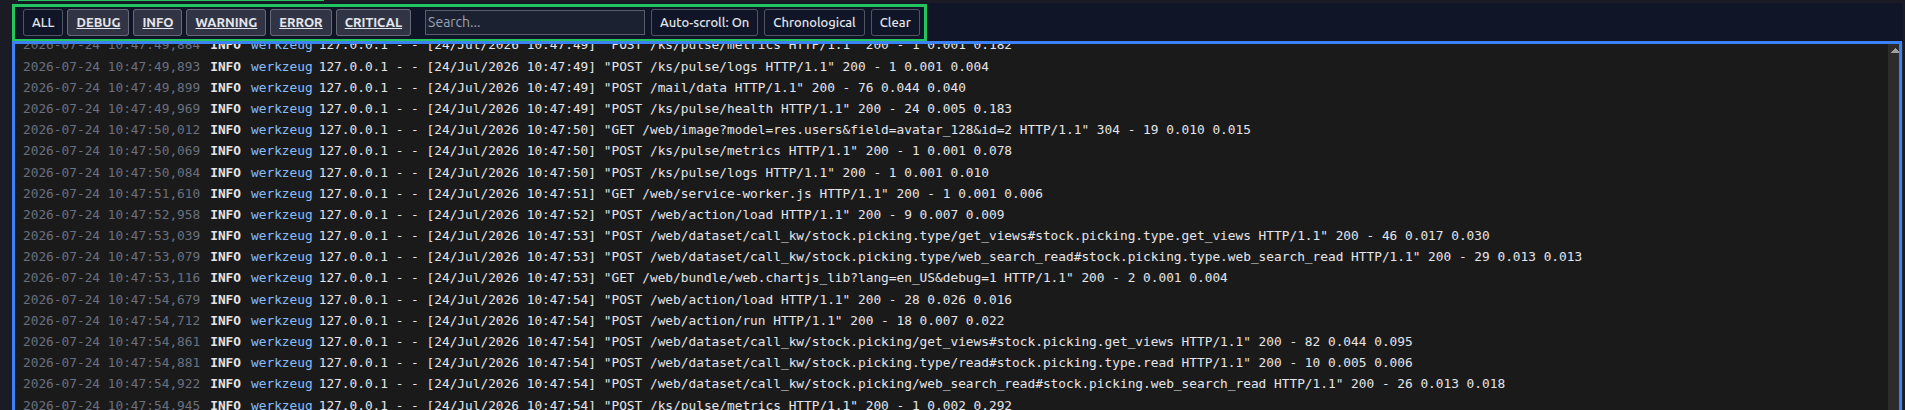
Tail your Odoo log file in real time, right from the browser, with instant level filtering and keyword search.

  • arrow icon Real-time Odoo log tailing: never a full-file load, always seek/tail
  • arrow icon DEBUG / INFO / WARNING / ERROR / CRITICAL level filters
  • arrow icon Free-text search, chronological ordering, autoscroll & clear
  • arrow icon All log content sanitized: sensitive lines are redacted before reaching the browser
SysVitals Live Server Logs
heightlights icon

Tracked Server Errors

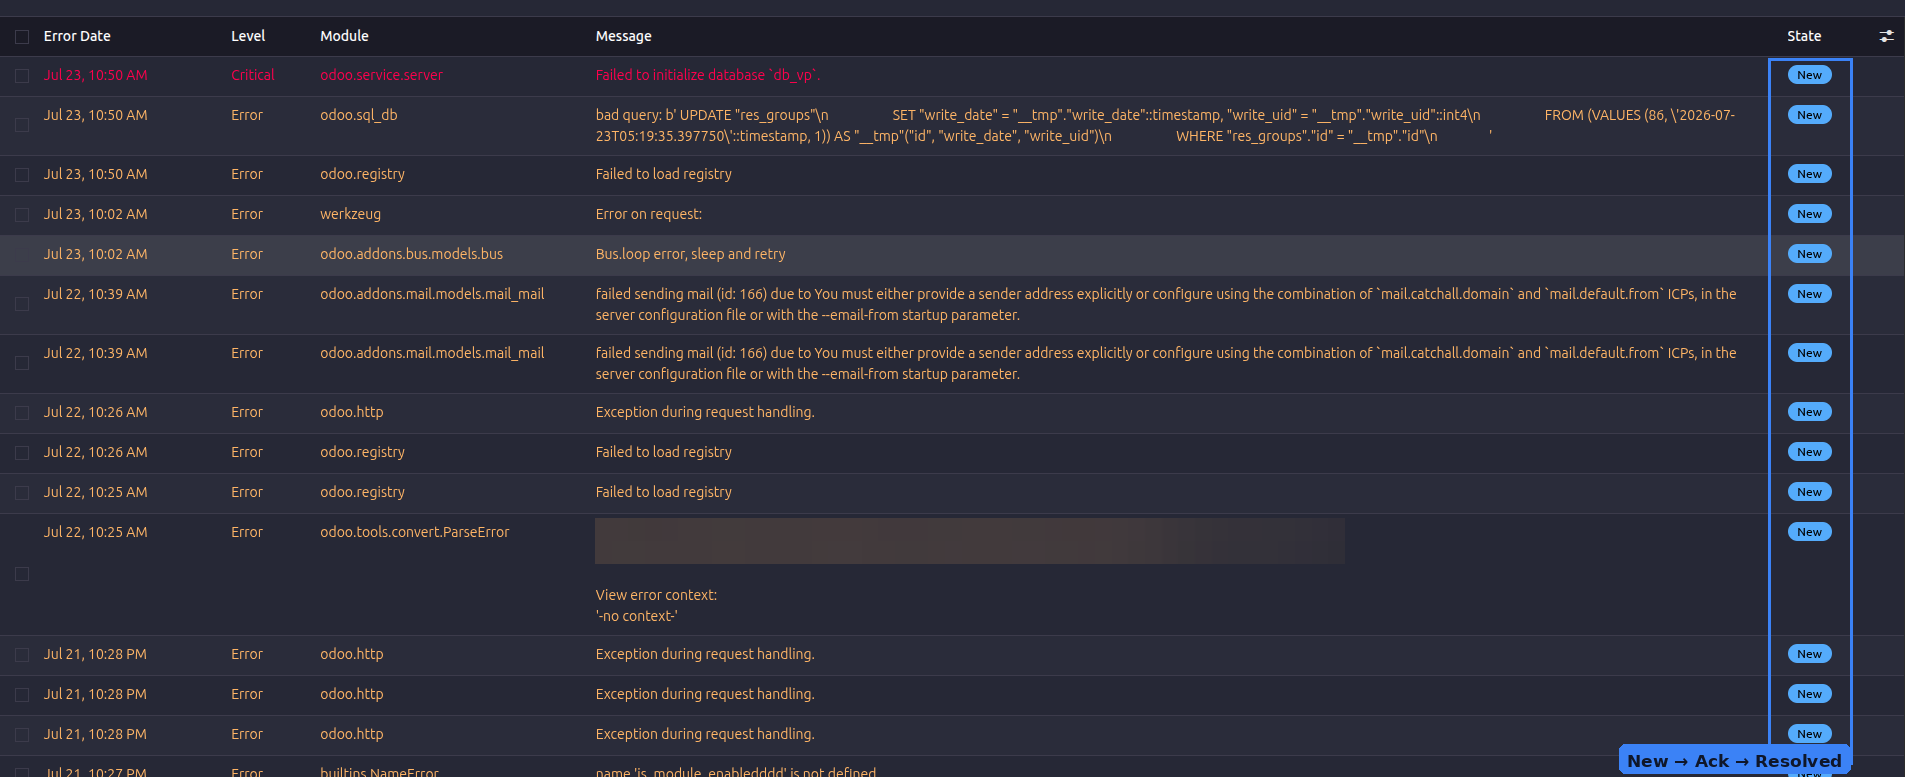
Every ERROR and CRITICAL line is automatically captured, deduplicated and tracked through a proper resolution workflow.

  • arrow icon Automatic ERROR/CRITICAL capture, deduplicated within a 60-second window
  • arrow icon New → Acknowledged → Resolved workflow with chatter & activities
  • arrow icon Full traceback capture at the moment an exception is raised, not just from the log file
  • arrow icon Bulk Acknowledge/Resolve server actions from the list view
SysVitals tracked Server Errors
heightlights icon

PostgreSQL Monitor

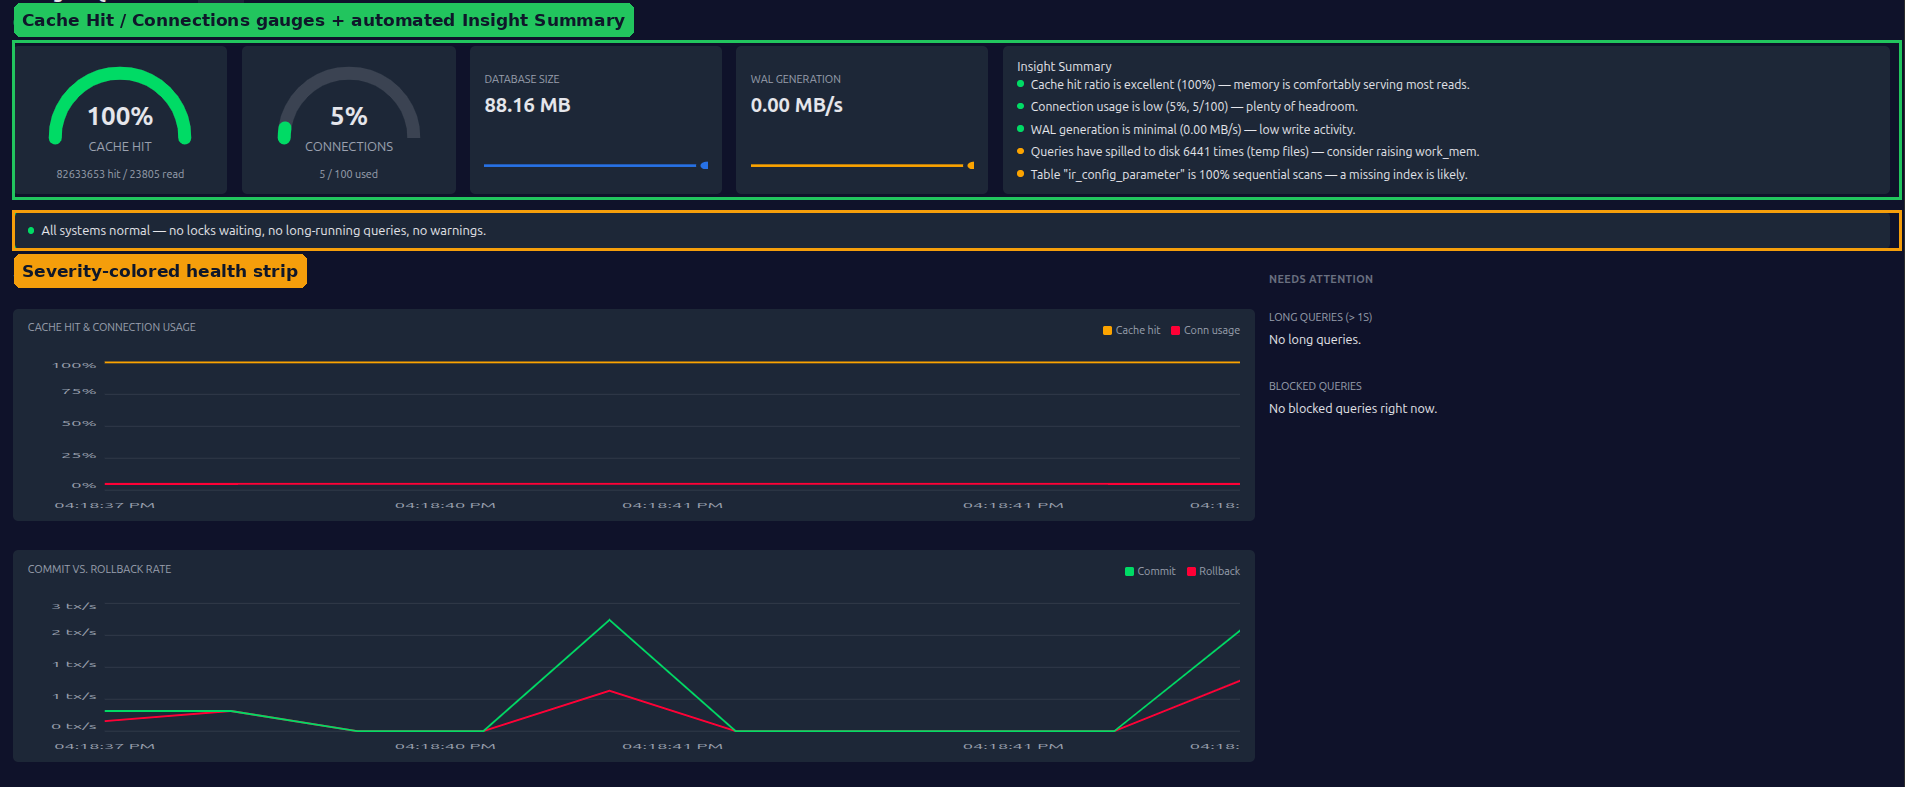
A dedicated health view for your database: connections, cache efficiency, locks, slow queries and autovacuum, all in one place.

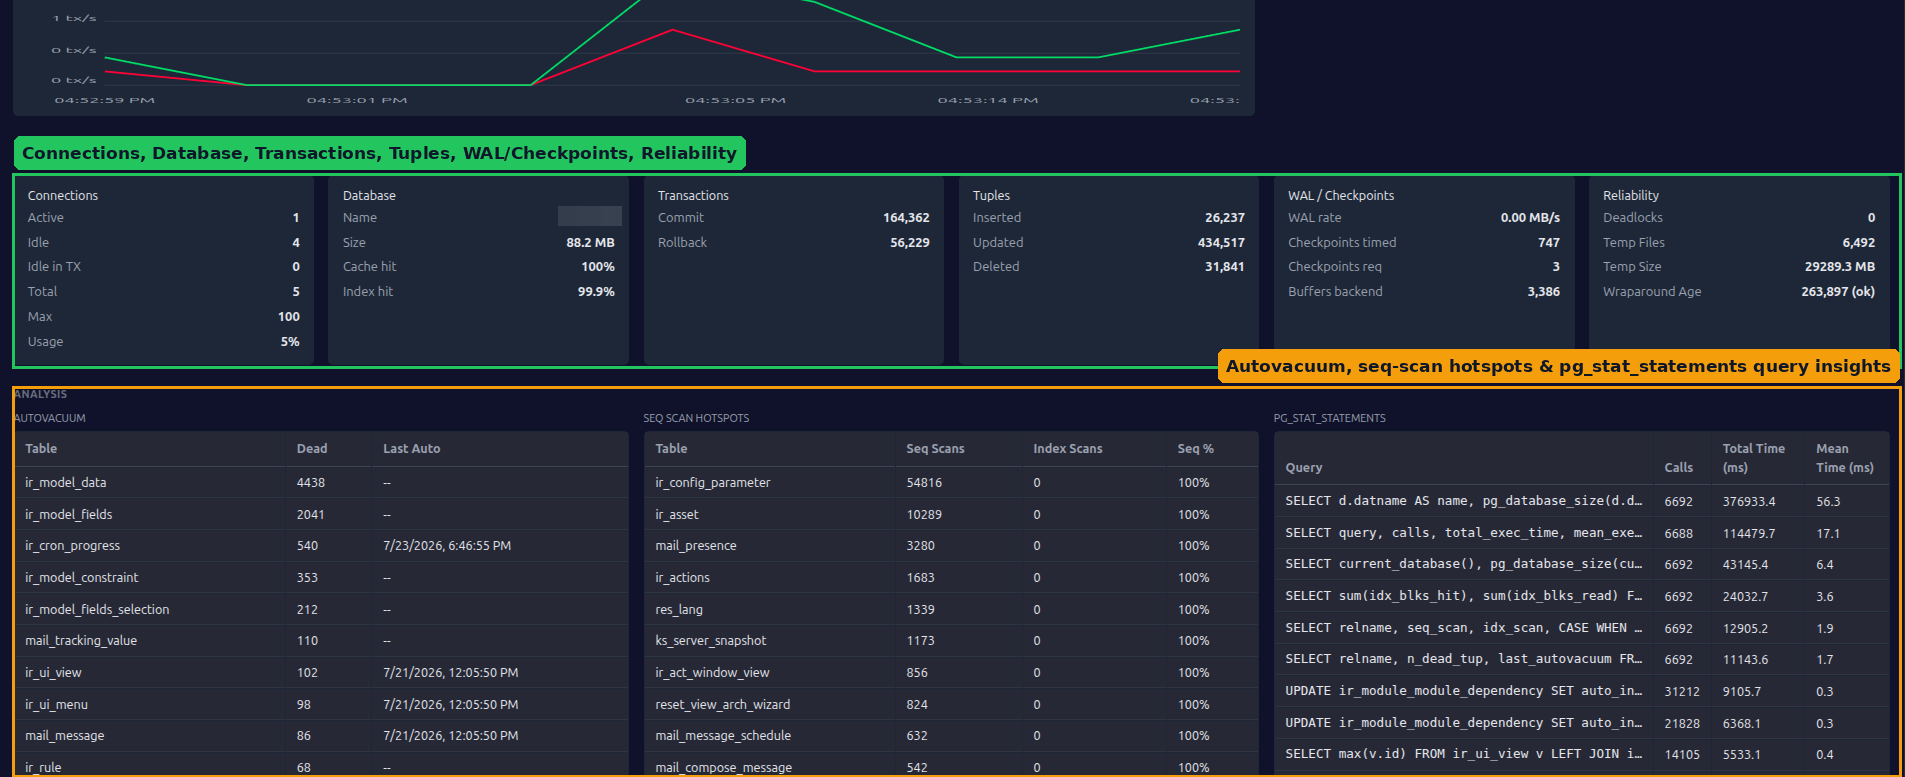
  • arrow icon Cache hit, connections, database size & WAL generation gauges
  • arrow icon Automated Insight Summary and a single severity-colored health strip
  • arrow icon Blocked/blocking locks & long-running query detection
  • arrow icon Autovacuum dead-tuple tracking & seq-scan hotspot detection
  • arrow icon Query Insights (pg_stat_statements) with a graceful "not installed" fallback
  • arrow icon Every query wrapped in its own savepoint, so a permission/version mismatch never breaks the page
SysVitals PostgreSQL Dashboard: hero gauges and trends
Cache hit, connections, WAL rate & trend charts
SysVitals PostgreSQL Dashboard: details and analysis
Connections/Database/Transactions/Tuples/WAL breakdown, autovacuum, seq-scan hotspots & query insights
heightlights icon

Threshold Alerts

Define your own limits for any metric and get notified the moment something crosses the line, before it becomes an incident.

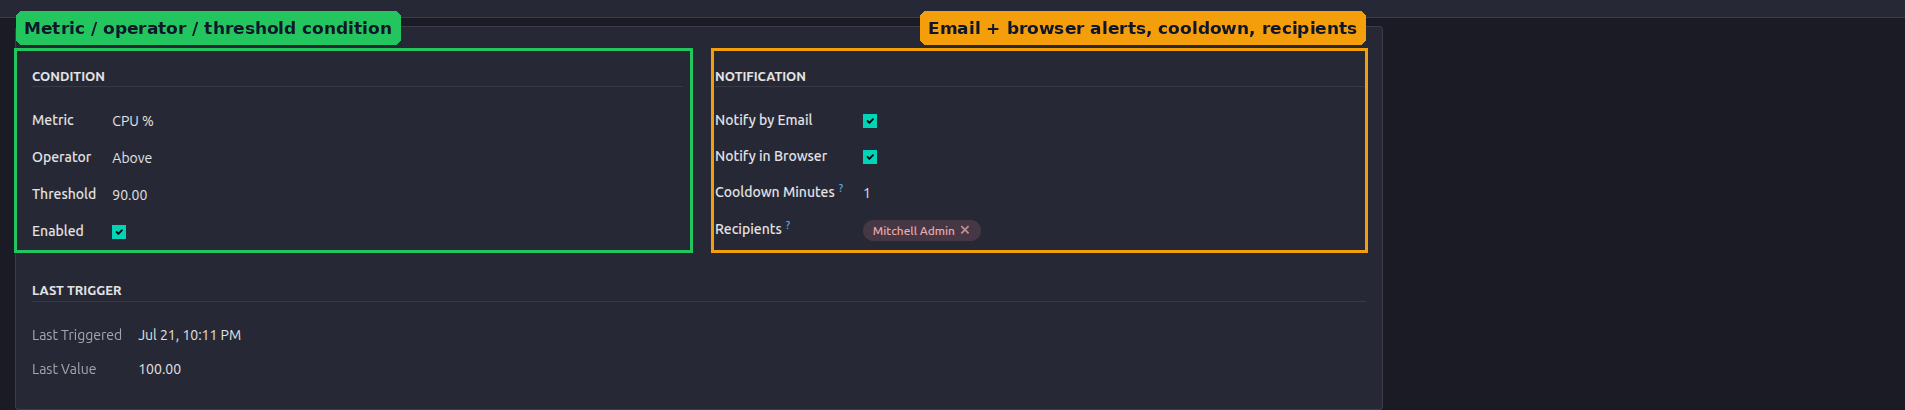
  • arrow icon Rules over CPU/RAM/Swap/Disk and DB Cache Hit/Connection Usage %
  • arrow icon Above/below operator, configurable threshold & cooldown
  • arrow icon Email and/or in-app browser notification, with optional recipient override
  • arrow icon Escalating repeat alerts instead of firing once and going silent
SysVitals Alert Rules
heightlights icon

Login Activity & Brute-Force Detection

Every login attempt is logged and aggregated, with automatic alerts when failed attempts for a user cross a configurable threshold.

  • arrow icon Every login attempt logged, aggregated per user email per day
  • arrow icon Configurable failed-attempt threshold with escalating re-alerts
  • arrow icon IP-based pivot view for manual pattern inspection
  • arrow icon Logging never changes whether a login itself succeeds or fails
SysVitals Login Activity
heightlights icon

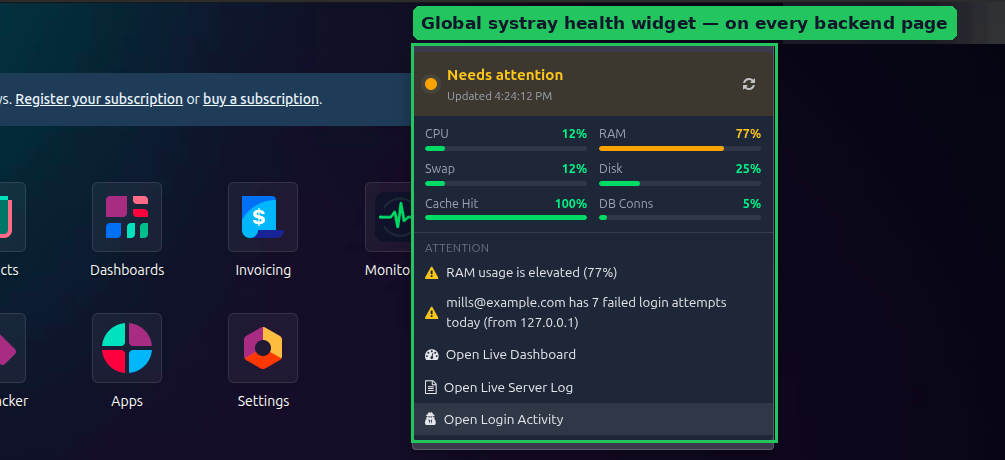
Global Systray Health Widget

A color-coded pulse icon in the systray keeps server health visible from anywhere in the Odoo backend, not just the dashboard.

  • arrow icon Color-coded heartbeat icon visible on every backend page
  • arrow icon One-glance CPU/RAM/Swap/Disk/Cache-Hit/DB-Conns summary
  • arrow icon Attention list merging OS, DB & login-security warnings
  • arrow icon No background polling: fetched on mount, dropdown open, or manual refresh only
SysVitals Systray Health Widget
heightlights icon

Configuration

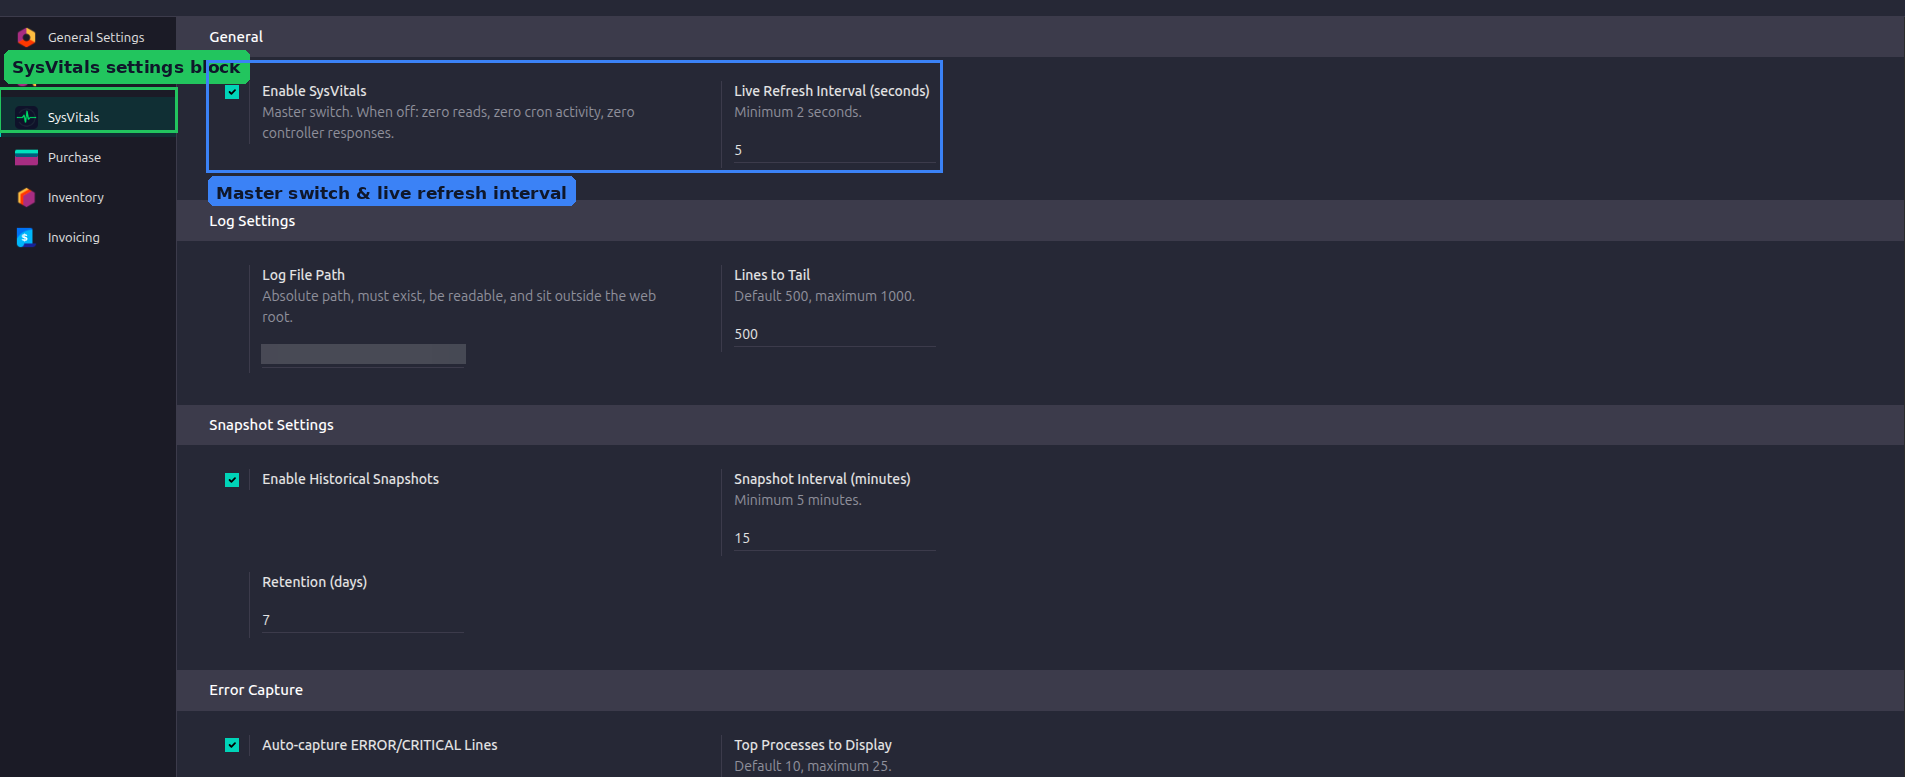
Fine-tune every aspect of SysVitals (refresh intervals, retention, thresholds and access) from one dedicated settings screen.

  • arrow icon Single master switch: off means zero reads, zero cron activity, zero controller responses
  • arrow icon Configurable live-refresh interval, log path, tail size & snapshot retention
  • arrow icon Independent toggles for DB monitoring, alerts, slow-ops & login logging
  • arrow icon Two dedicated security groups: SysVitals / Dashboard User (read-only) & SysVitals / Administrator
SysVitals Configuration Settings
Support

Free 90 Days Support

Ksolves provides free 90 days support for any doubt, queries and bug fixing (excluding data recovery) or any type of issues related to this module. This is applicable from the date of purchase.

Note: Extensively tested on Odoo Vanilla with Ubuntu OS
90 DAYS

Why Ksolves

You know us as the makers of Dashboard Ninja. You will remember us for SysVitals.

Your trusted partner in offering tailored solutions for your unique business vision.

Ecommerce Development
CMMI Level 3 Certified
Odoo Gold Partner
Odoo Gold Partner
Client Retention
84.3% Client Retention Rate
Have Unique Requirements?
Choose Ksolves

Share your specific business requirements or challenges with us, and let us craft a custom solution that meets your needs.

Get in Touch
Expert Team
520+ Experts
Odoo Customization
Odoo Customization
Odoo Mobile App Development
24/7 Support
24/7 Support

Why Choose Ksolves for SysVitals

  • Checked15+ years of enterprise software delivery experience
  • CheckedOfficial Odoo Gold Partner
  • CheckedCMMI Level 3 appraised development process
  • CheckedDedicated support team for every module we publish
  • CheckedModules engineered against real, running Odoo instances, not just written to spec
  • CheckedSecurity-first design: group-gated access, sanitized data, no unsafe defaults
  • CheckedTransparent about deviations, trade-offs and what's verified vs. pending
  • CheckedCustom development & consulting available on request

Frequently Asked Questions

No. Every metric (CPU, RAM, disk, network, processes) and the live log stream are read directly by the module via psutil and file tailing, and shown entirely inside the Odoo backend UI.
Yes. Every DB query runs inside its own savepoint, so a permission-restricted query (e.g. WAL rate, which needs pg_monitor) simply degrades to "unavailable" instead of breaking the rest of the page or the request's transaction.
No. The Query Insights panel only activates if the pg_stat_statements extension is already installed at the Postgres level; otherwise it shows a clear "not installed" message.
Access is restricted to two dedicated groups: SysVitals / Dashboard User (read-only) and SysVitals / Administrator (full access + configuration). Members of the core Settings/Administration group are automatically added to the Administrator group on install.
Via email and/or Odoo's own in-app browser notification (the same bus mechanism core Odoo uses for chatter), per Alert Rule, with a configurable cooldown and optional escalating repeat alerts.
It's opt-in and off by default. When enabled it uses officially-supported Odoo extension points (no monkeypatching), with lightweight cached flags checked on the hot path rather than a database read per request.

Release Notes

  • 19.0.1.0.0 New Version Released | 24 August 2026
    • CheckedLive Dashboard, Live Server Logs, historical Snapshots & tracked Errors workflow
    • CheckedPostgreSQL Monitor: connections, cache hit, locks, long/slow queries, autovacuum, query insights
    • CheckedThreshold Alert Rules (email + in-app), with escalating repeat alerts
    • CheckedSlow-operation tracking for HTTP/RPC, cron jobs & SQL queries (opt-in)
    • CheckedLogin Activity logging with brute-force detection & IP pivot view
    • CheckedGlobal systray health widget on every backend page
Onboarding
Getting Started
Step 1
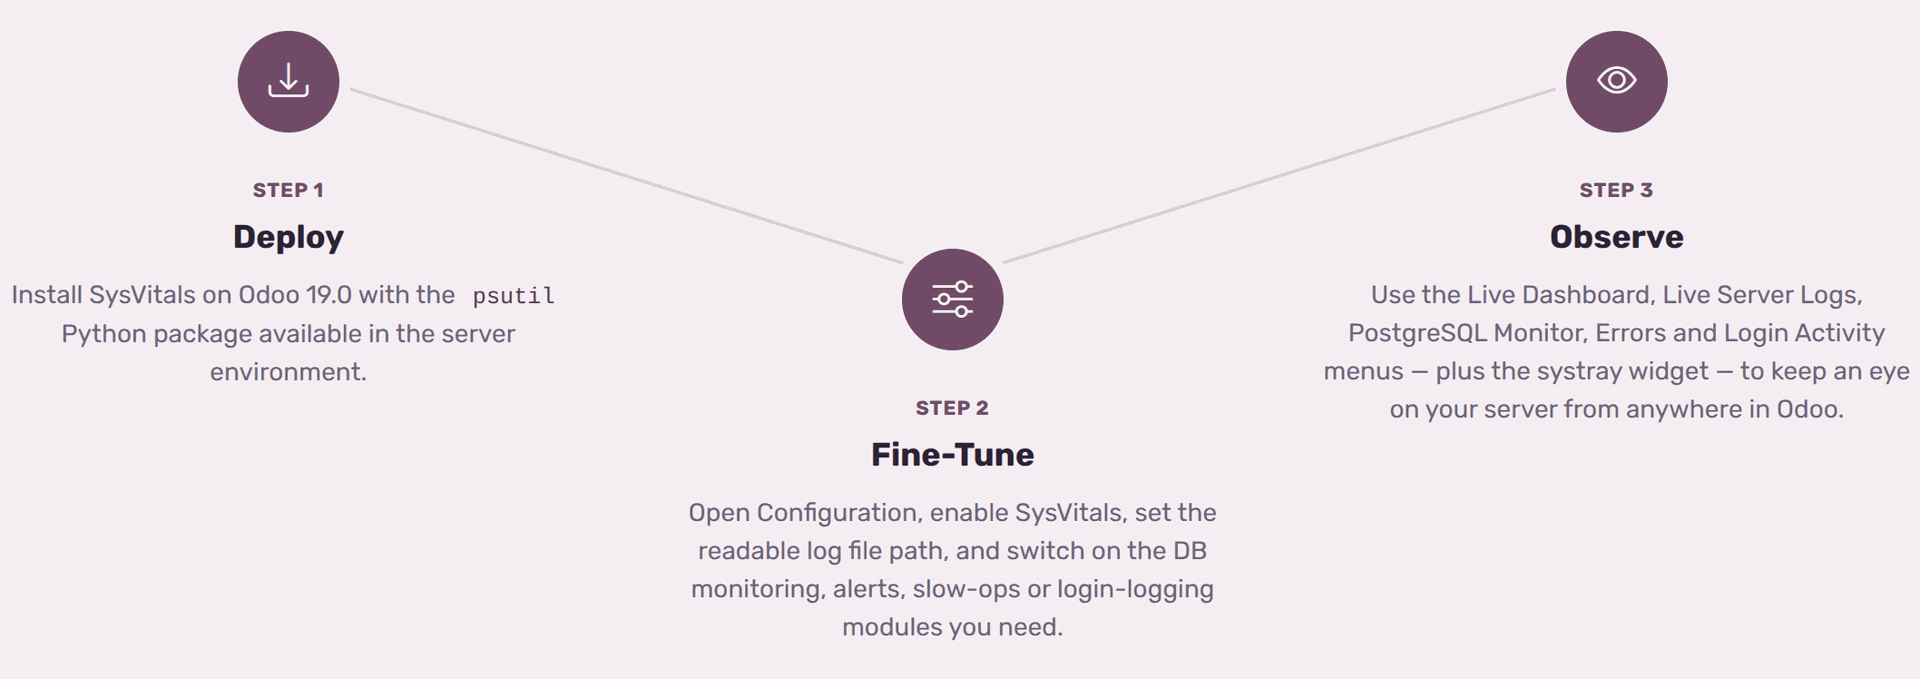
Deploy

Install SysVitals on Odoo 19.0 with the psutil Python package available in the server environment.

Step 2
Fine-Tune

Open Configuration, enable SysVitals, set the readable log file path, and switch on the DB monitoring, alerts, slow-ops or login-logging modules you need.

Step 3
Observe

Use the Live Dashboard, Live Server Logs, PostgreSQL Monitor, Errors and Login Activity menus (plus the systray widget) to keep an eye on your server from anywhere in Odoo.

Onboarding steps
Steps Line
Onboarding steps 1
1. Deploy

Install SysVitals on Odoo 19.0 with the psutil Python package available in the server environment.

Onboarding steps 2
2. Fine-Tune

Open Configuration, enable SysVitals, set the readable log file path, and switch on the DB monitoring, alerts, slow-ops or login-logging modules you need.

Onboarding steps 3
3. Observe

Use the Live Dashboard, Live Server Logs, PostgreSQL Monitor, Errors and Login Activity menus (plus the systray widget) to keep an eye on your server from anywhere in Odoo.

Onboarding bullets Requirements

SysVitals runs inside the Odoo process itself, so it needs local access to the host it's running on.

Checked Odoo 19.0, Community or Enterprise Checked Python package psutil Checked Readable log file on the host Checked Admin access (base.group_system) for setup

ideal icon Ideal For

ideal icon

Self-hosted teams: running and owning their own Odoo server, on-premise or on a VPS.

ideal icon

Security-conscious admins: want server & database visibility without opening up SSH.

ideal icon

Lean ops teams: would rather not stand up a separate monitoring stack.

ideal icon

Heads up: managed/sandboxed hosting may restrict host-level metrics or log access, so check with your provider first.

SysVitals  |  Odoo Live Server Insights  |  Ksolves  |  sales@ksolves.com

Free 120 Days Support

Get 120 days of FREE support (doubt, queries, & bug fixing) on Odoo
applications from the date of purchase. Enhance the functionality of
your business with the Ksolves Odoo experts.

pic

Get your Personalized Demo

0/50 characters
0/100 characters