pic
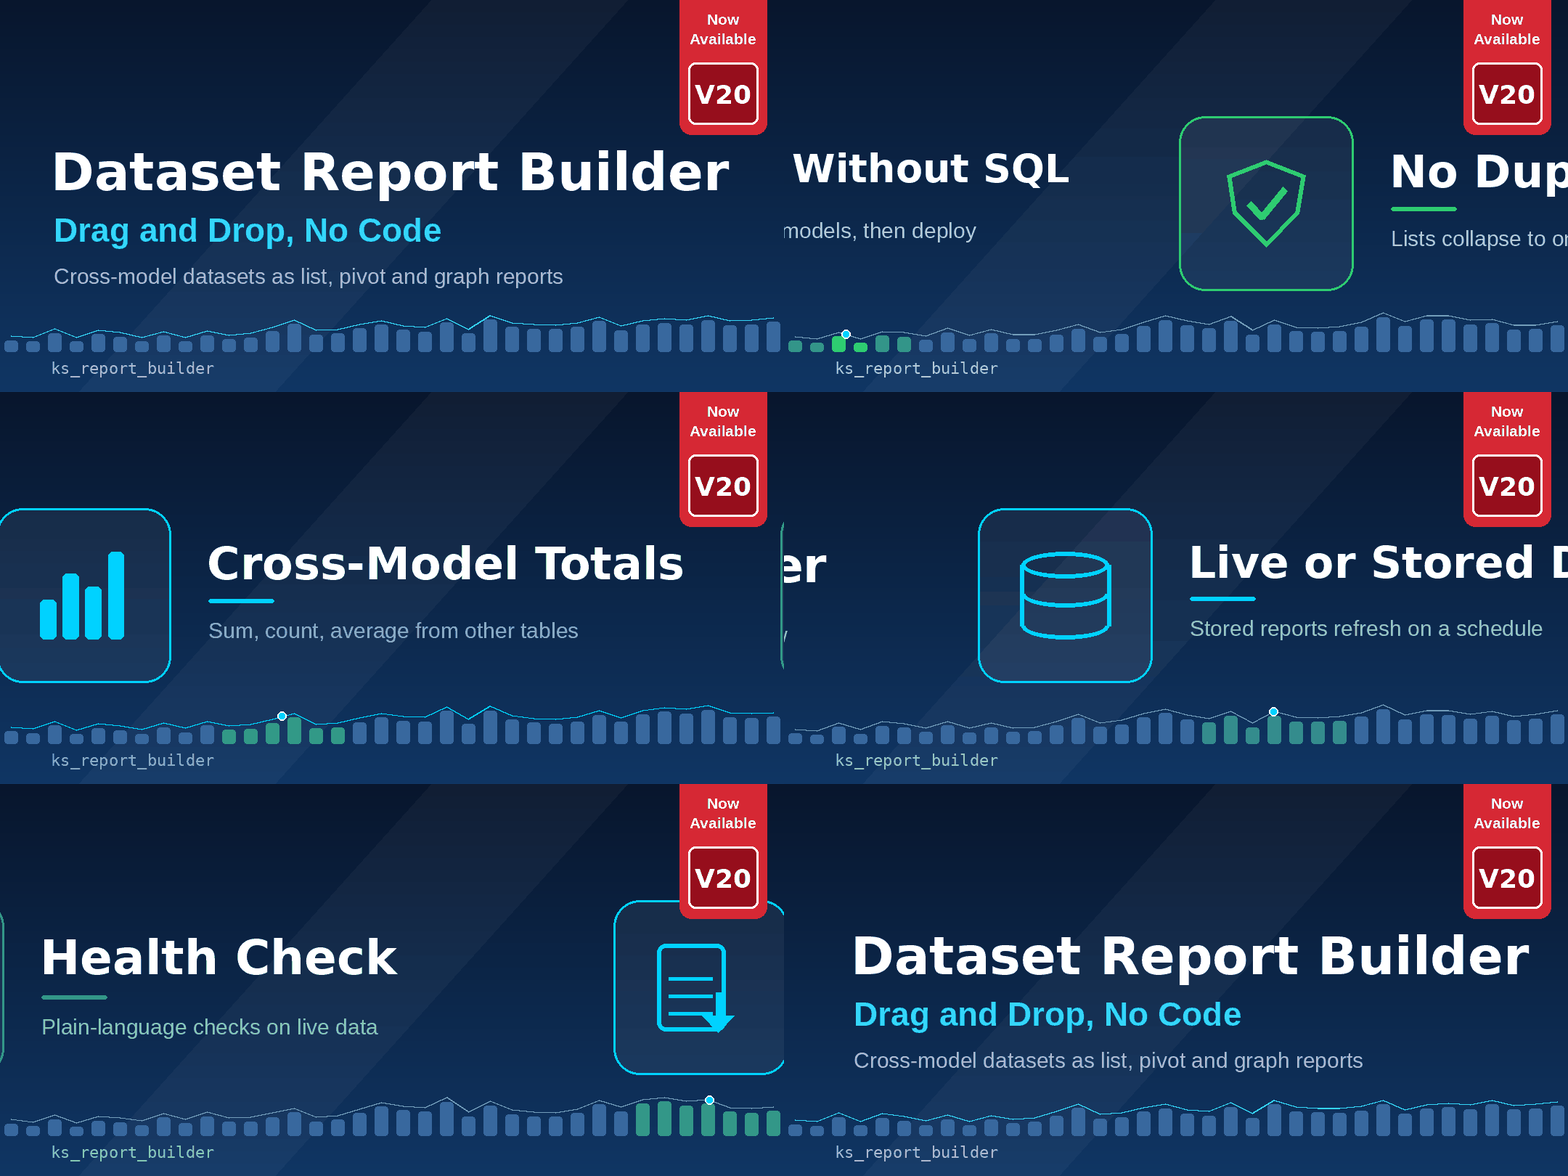
Dataset Report Builder: Drag and Drop, No Code (20.0)
120 Days
Free Support
Free
Lifetime Update
Free
Installation

Dataset Report Builder: Drag and Drop, No Code (20.0)

Custom Report Builder: Drag and Drop, No Code


Supported Versions

All the compatible versions

49.00 € 49.0 EUR

49.00 €
Installation: Free
Support Period for 4 Months: Free

Live Demo
120 Days
Free Support
Free
Lifetime Update
Free
Installation

Dataset Report Builder iconKsolves · Odoo 20.0

Dataset Report Builder

Drag & Drop Datasets. No SQL. No Code.

Turn your Odoo data into clean, reusable datasets from the UI. Pick a base model, follow its relations on a visual canvas and deploy a real, read only report with list, pivot, graph and search views, with numbers you can trust, because every row stays one record.

Odoo 20.0
Community & Enterprise
0 lines
of SQL or Python
9 checks
automatic Health Check
5 aggregators
cross model lookups
Live or Stored
choose per report
✓
Visual or form based building
Drag and drop ER style canvas, or the classic Report Definitions form. Both produce the same report.
✓
Real, native Odoo reports
List, pivot, graph and search views, an action and a menu entry. No database views, no migrations.
✓
One row per record, always
Crossing a list relation never duplicates rows, so totals and counts are never silently multiplied.
✓
Health Check on live data
Nine checks find the numbers that look right but are wrong, with a plain language fix.
Positioning
Reports your users can trust.

Most report builders join tables and quietly double count. Dataset Report Builder collapses every list into one value per row, and tells you when a total could mislead.

Start your evaluation

To get an expert, set up a demo and evaluate with guidance, choose any option below
SCAN OR CLICK
Email
Scan to email Ksolves sales about Dataset Report Builder
SCAN TO CHAT
WhatsApp
Scan to WhatsApp Ksolves sales about Dataset Report Builder
+91 85274 71031
LIVE SESSION
Book a demo

Ask for a walkthrough on your own use case and get answers from the team that built it.

Request a demo

Why correctness matters for your reports

Depth comes from solving real problems, not from adding more buttons
≡
No duplicated rows

List relations are collapsed inside a correlated subquery, never joined. Totals and counts stay exact.

❐
No duplicate columns

Two columns computing identical data are refused, compared by what they compute, not by their label.

⚭
Generic relation safety

One to many fields with no fixed model (such as message logs) are filtered to the right records only.

⚠
No SQL injection surface

Computed columns accept arithmetic over declared numeric columns only, no free text, no function calls.

●
Read only by design

Generated reports cannot create, edit or delete records. Changes happen on the real records only.

⚡
Indexed for speed

Stored reports are indexed on the columns they join, group and filter on.

Everything you need to build and trust a report

One module · two ways to build · every report checked
✎
Report authoring
✓ Any base model, field chains of any depth
✓ Field, Computed and Aggregate column types
✓ Searchable and Group By toggles per column
✓ Automatic date period filters
▦
Visual Designer
✓ Drag and drop ER style canvas
✓ Live preview of up to 200 real rows
✓ Zoom 50% to 150% and pan
✓ Edit any existing report in the Designer
⇅
List relations
✓ List as text, First, Last or Count
✓ Chained lists and many2many supported
✓ Optional List Filter before collapsing
✓ Misalignment warnings with a suggested fix
Σ
Aggregates & computed
✓ Sum, Count, Average, Maximum, Minimum
✓ Pull numbers from unrelated tables
✓ Arithmetic with Insert Field helper
✓ Division by zero always handled
⚙
Storage & filters
✓ Live, or Stored in an indexed table
✓ Hourly, daily, weekly or manual refresh
✓ Filter and Result Filter, no redeploy
✓ Failed refresh keeps the previous data
⇩
Deliver & control
✓ Formatted Excel export in one click
✓ Visible To groups per report
✓ Menu placement, movable any time
✓ Snapshot Fields freeze values at creation

See it in action

Real screens from a running Odoo 19 instance
01Visual Designer

Build reports like an ER diagram

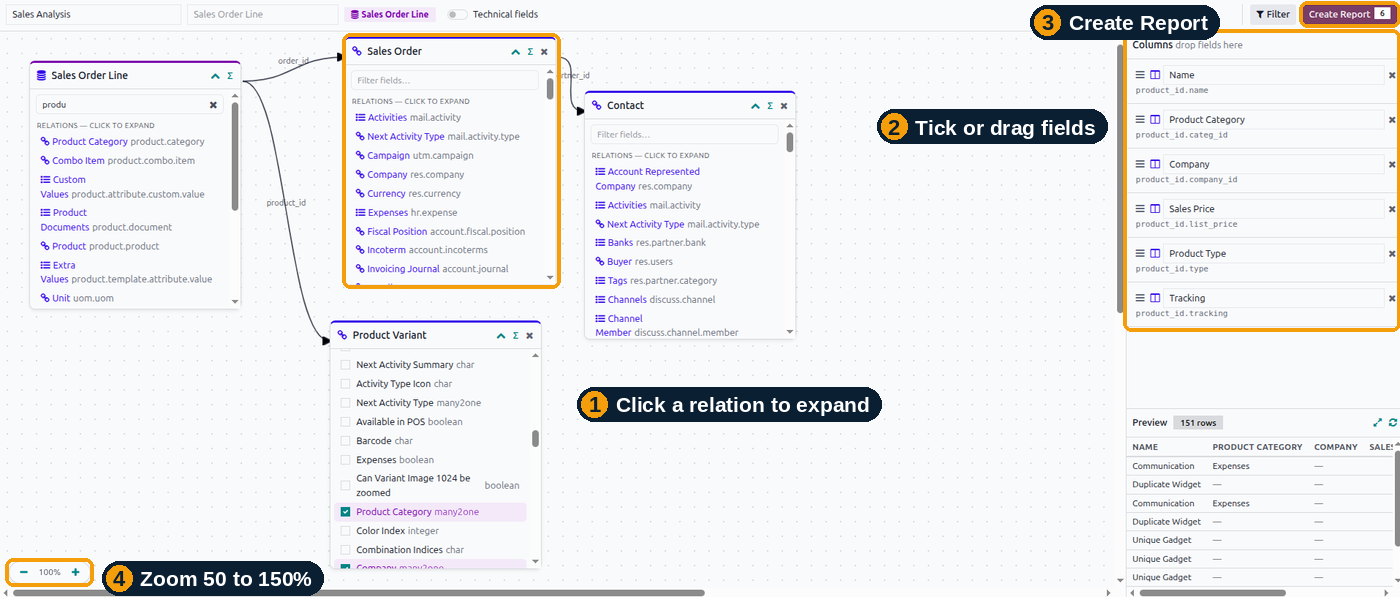
Search for a base model, then click any relation on its card to expand it into a new connected card. A card can only exist by following a real relation, so every path you build is valid.

✓ Tick a field or drag it into the Columns panel, both create the same validated column
✓ Zoom from 50% to 150% and pan across large diagrams
✓ Reopen any existing report with Edit in Designer
Report Designer canvas
Cards connected by real relations on the Designer canvas
02Live Preview

See real rows before you save anything

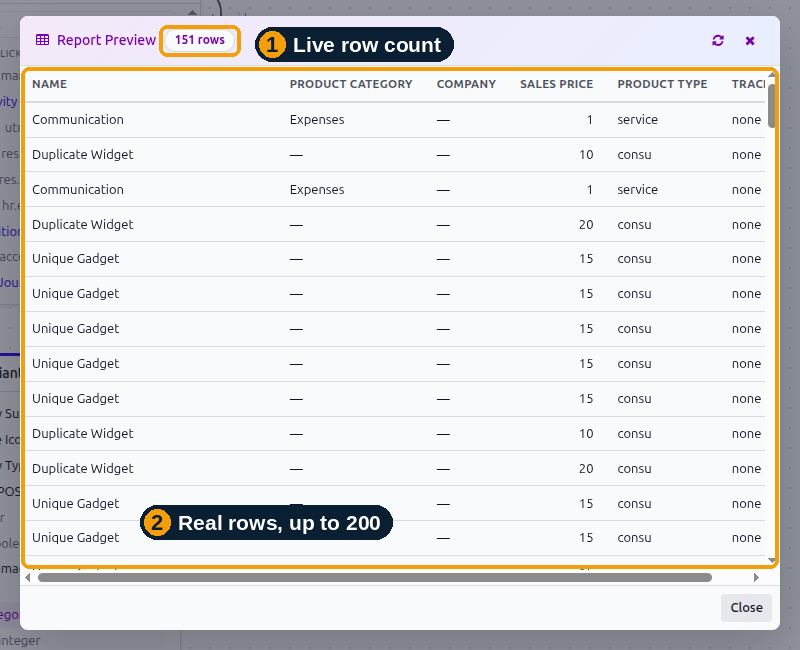
A running preview of actual data updates as you add, remove or reconfigure columns, so you catch a wrong column before it is deployed.

✓ Expand the preview to a full screen view of up to 200 rows
✓ Automatic warning when two “list as text” columns from one relation cannot be read as matching pairs
✓ Aggregate columns are built visually, only valid combinations are offered
Designer live data preview
Live preview of real rows inside the Designer
03Report Definitions

Prefer a form? Use the classic builder

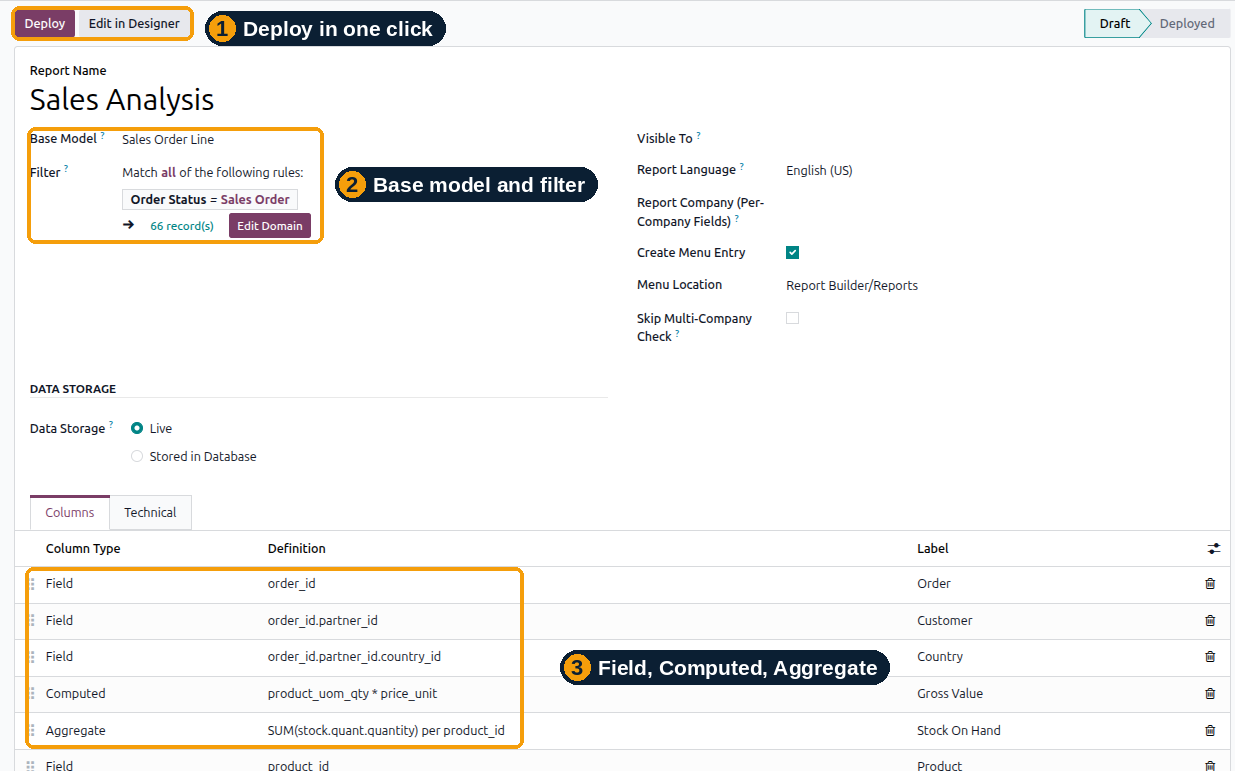
Every report can also be defined on an ordinary Odoo form. Choose a base model, add columns, name the report and click Deploy.

✓ Field paths of any depth in a single picker, for example Order → Customer → Country → Name
✓ Three column types: Field, Computed and Aggregate
✓ Searchable and Group By toggles per column, the search view is generated for you
Report Definitions form
Report Definitions form with the Columns tab
04When Multiple

Read one to many data without duplicate rows

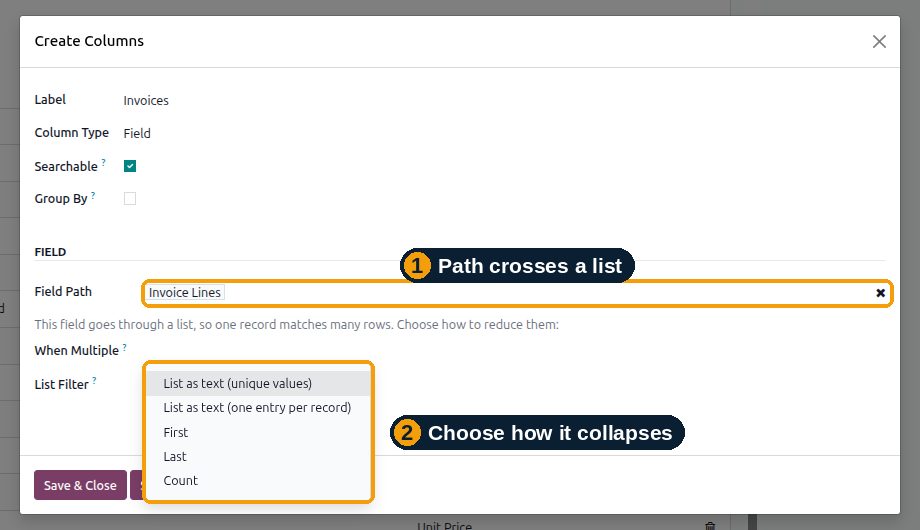
Crossing a list relation never fans out rows. Choose how many related records collapse into one value, every report stays exactly one row per base record.

✓ List as text (unique values, or one entry per record)
✓ First / Last: keeps the real type, so a product stays a clickable link
✓ Count of related records, with an optional List Filter
✓ Works across several chained lists and through many2many relation tables
When Multiple setting
When Multiple options on a list crossing column
05Aggregate Columns

Pull numbers from tables with no direct relation

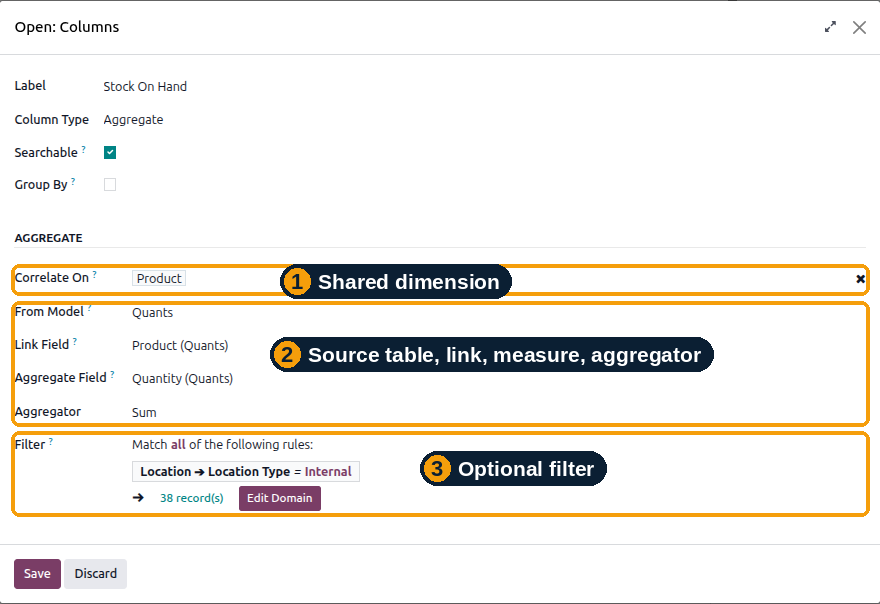
Show, for example, a product’s total stock quantity on a sales report. Link the two tables through a shared dimension and choose the aggregator.

✓ Sum, Count, Average, Maximum or Minimum
✓ Optional filter on the source table to narrow the rows aggregated
✓ The Health Check flags aggregate columns that only total correctly when grouped
Aggregate column setup
Aggregate column: Correlate On, From Model, Link Field, Aggregator
06Computed Columns

Arithmetic without a formula editor headache

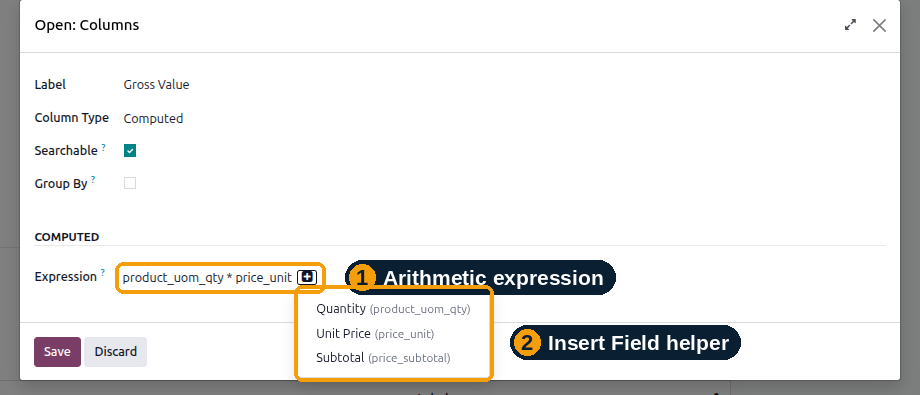
Combine numeric columns already in the report with + − × ÷. The Insert Field helper writes the technical name for you.

✓ Only arithmetic over declared numeric columns is accepted, never free text or function calls
✓ Result Filter can then filter on the computed value
Computed column with Insert Field
Computed column using the Insert Field helper
07Deployed Report

A real Odoo report, not a mockup

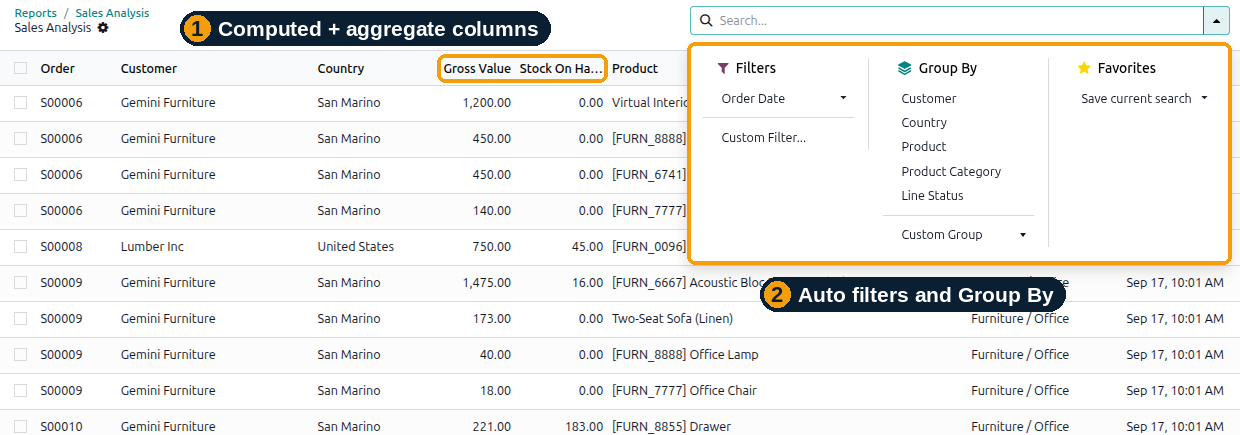
Once deployed, the report behaves like one a developer built by hand: list, pivot, graph and search views, an action, and a menu entry you can move at any time.

✓ Automatic “This Month / Last Quarter / 2025” period filters on every date column
✓ Read only end to end, no record can be created, edited or deleted through a report
✓ Undeploy and redeploy without losing the definition
Deployed report list view
Generated list view with search panel
08Pivot & Graph

Analyse without leaving Odoo

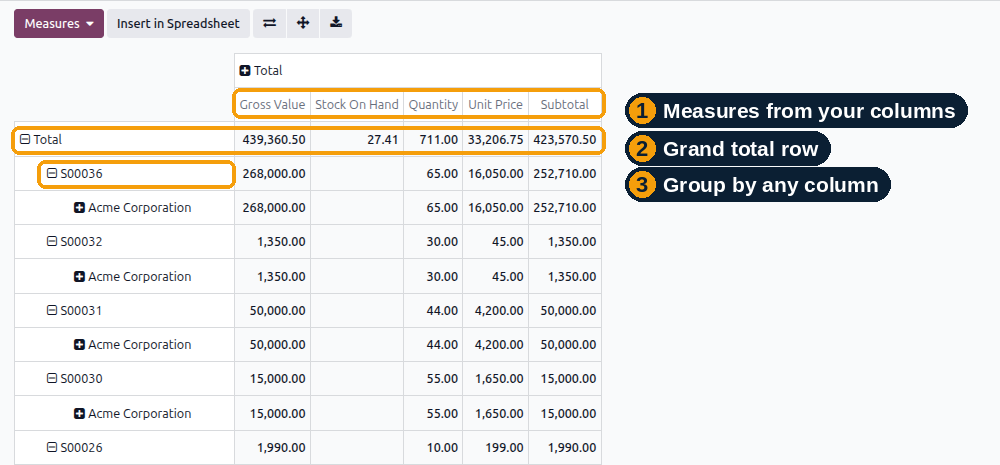
Every deployed report ships with pivot and graph views, ready to group by any column you marked groupable.

✓ Group By toggles are set per column
✓ Aggregation rules respect each column’s real meaning, totals where they make sense, averages where they do not
Pivot and graph views
Pivot view of a deployed report
09Filters

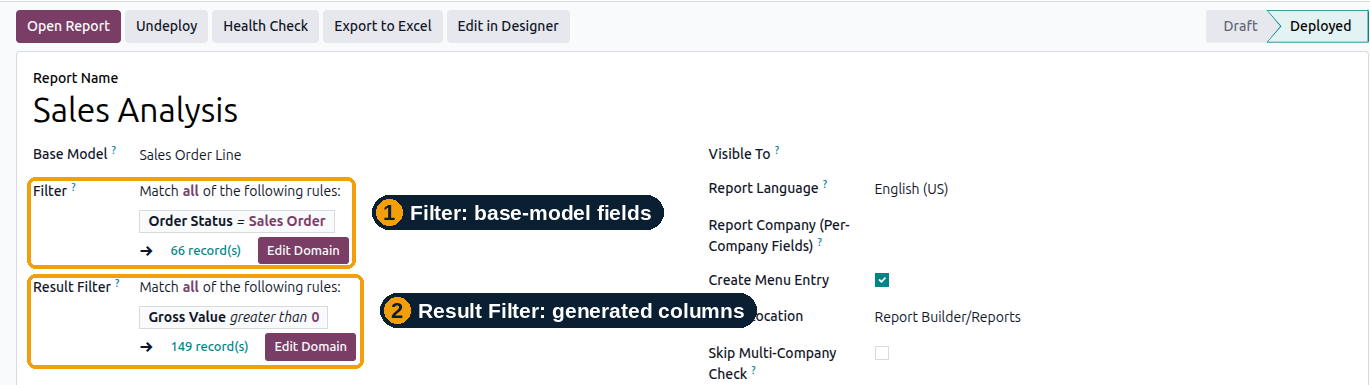
Two filters for two different jobs

The Filter applies to the base model’s fields before the report is built. The Result Filter applies to the generated columns, including computed and aggregate ones.

✓ Both can be edited on a deployed report with no redeploy
✓ Hide rows with no activity using a Result Filter on a computed total
Filter and Result Filter
Filter and Result Filter on a deployed report
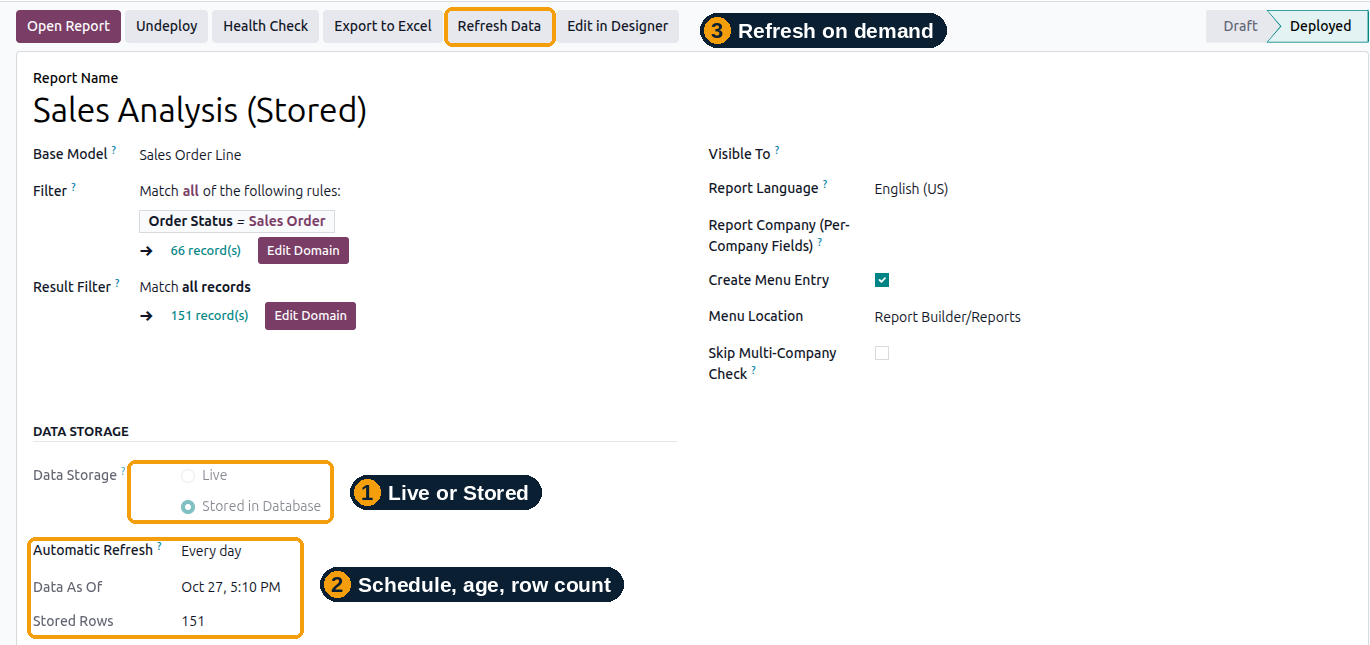
10Data Storage

Live when you need fresh, Stored when you need fast

Choose before deploying. Live reports query on every open. Stored reports save their result into an indexed table and refresh on a schedule.

✓ Refresh every hour, day, week, or manually with Refresh Data
✓ Data As Of and Stored Rows shown on the form
✓ A failed scheduled refresh keeps the previous data and is shown on the form and in the Health Check
✓ Filters still apply when the report is opened, no refresh needed after changing one
Stored data mode
Stored mode: schedule, Data As Of and Stored Rows

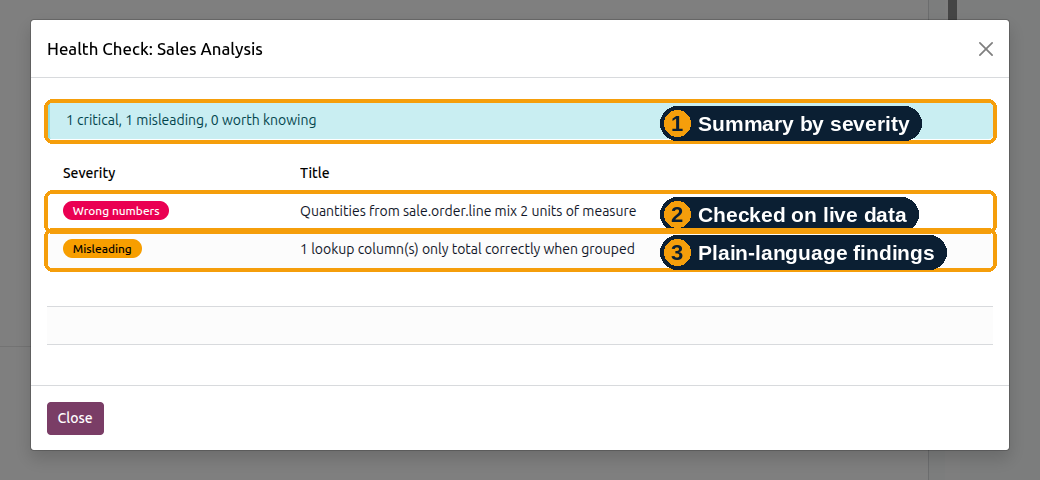
Numbers that look right, and are

Report Health Check · nine checks on real, live data
1 Mixed units of measure: a quantity total silently adding Units to Hours. WRONG NUMBERS
2 Mixed currencies: an amount total spanning more than one currency. WRONG NUMBERS
3 Archived records included: rows a normal Odoo view would hide. MISLEADING
4 Rows the source model would hide: an access rule the report cannot apply. MISLEADING
5 Lookup columns that need grouping: aggregate columns that repeat their value across rows. MISLEADING
6 Computed columns showing 0.00: an empty lookup masked as a real zero. MISLEADING
7 Text lists that do not line up: two list columns that look like pairs but are not. MISLEADING
8 Missing database indexes: aggregate columns that will scan a growing table. WORTH KNOWING
9 Stored data age: when a Stored report was last refreshed, and whether a refresh failed. WORTH KNOWING
Report Health Check result
Health Check findings grouped by severity
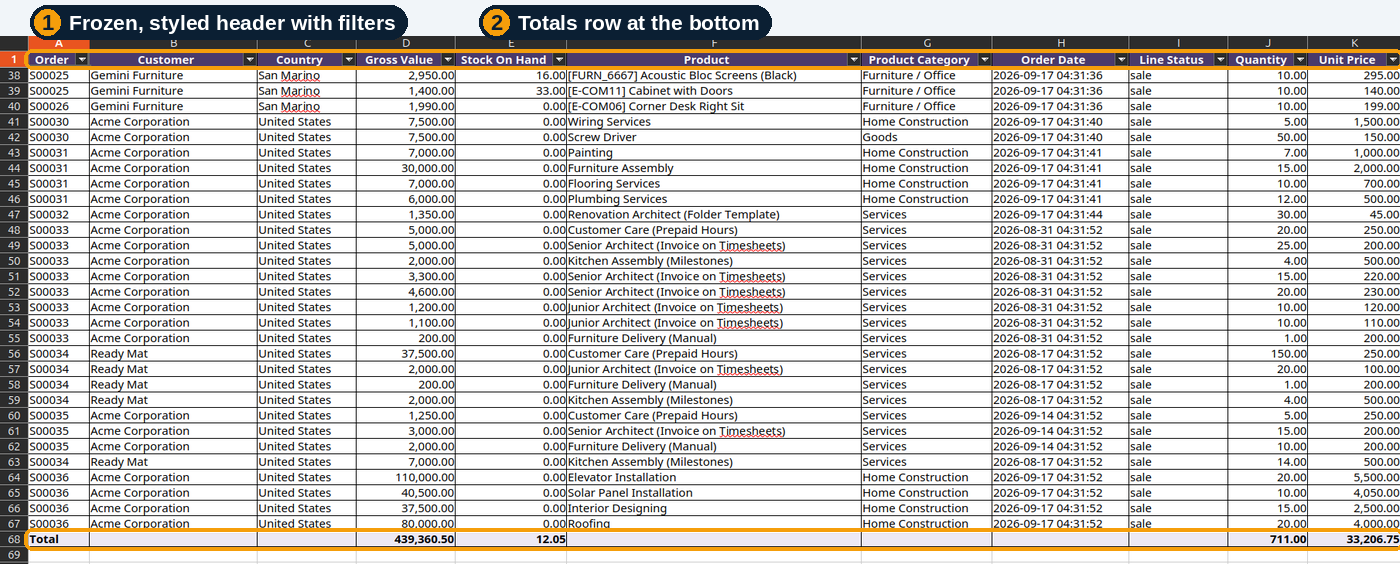
11Excel Export

A formatted .xlsx in one click

Download any deployed report as a ready to share workbook.

✓ Styled header, frozen top row, filter on every column and correctly typed number formats
✓ Totals row that follows each column’s real aggregation rule
✓ Always applies the report’s Filter and Result Filter and the viewer’s own access rights, never more data than the report itself shows
Exported Excel file
Exported workbook
12Snapshot Fields

Freeze a value at the moment a record is created

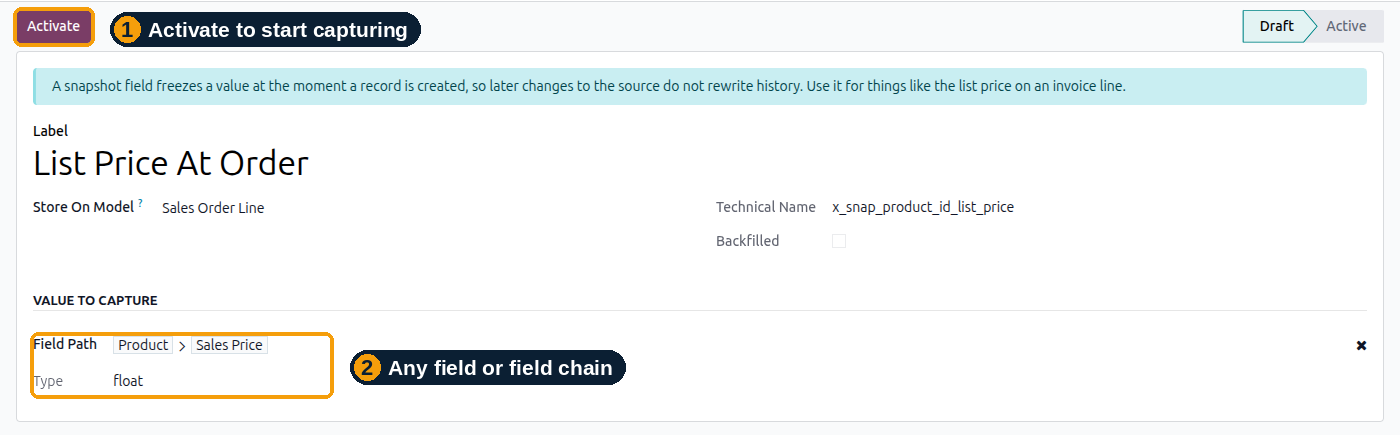
Add a stored field to any Odoo model that captures a value once, for example the list price when an invoice line was created, and never changes again, even if the source is edited later.

✓ Works on any Odoo model, not only report builder models
✓ Backfill fills existing records with today’s value (the true historical value was never captured)
✓ Deactivate permanently removes the field and its stored values
Snapshot Fields form
Snapshot Field definition and Activate button
13Access & Menus

Decide who sees what, and where it lives

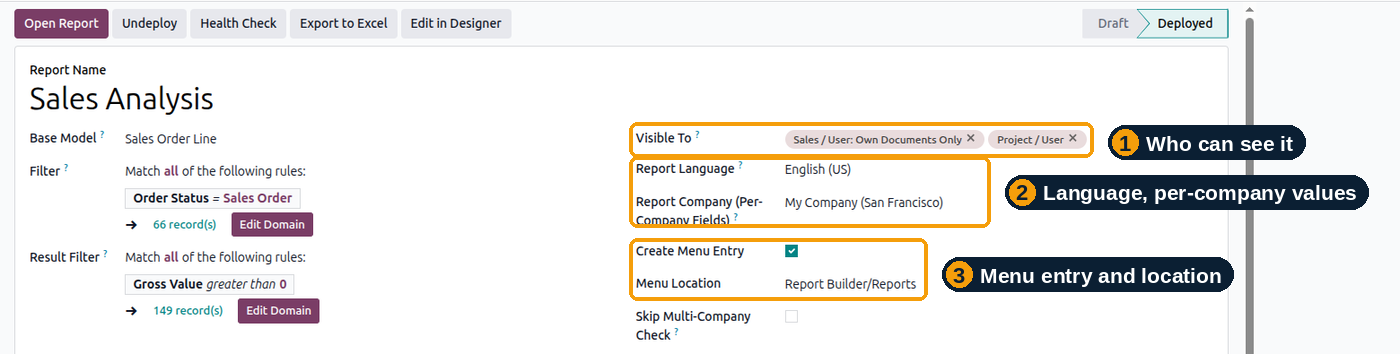
Each report has its own Visible To groups. On models with multi company data a matching company safe access rule is generated automatically.

✓ Place the report anywhere in the menu tree and move it later without a redeploy
✓ Report Language for translated fields, Report Company for per company fields
✓ Two groups: Viewer opens deployed reports; Designer defines and deploys them
Visible To and Menu Location
Visible To, Menu Location and report language settings

Before you decide

Evaluate with your own data
Test it with your own workflows
Evaluate Dataset Report Builder using your own data.

The quickest way to judge a report builder is to rebuild a report you already rely on, then run the Health Check against it.

✓ Install on a copy of your database
✓ Rebuild one of your real reports in the Designer
✓ Run the Health Check and compare the numbers
✓ Talk to us before you decide
What you will see
Answers, not a sales pitch
✓ Whether your existing reports can be rebuilt without code
✓ Where a total could silently be wrong
✓ How fast Live and Stored mode are on your volumes
Evaluate with an expert →
Support
Free 90 Days Support

Ksolves provides free 90 days support for any doubt, queries and bug fixing (excluding data recovery) or any type of issues related to this module. This is applicable from the date of purchase.

Note: Extensively tested on Odoo Vanilla with Ubuntu OS.

Included with purchase
90 days of expert help

From the date of purchase.

✓ Doubts and queries answered
✓ Bug fixing
✓ Any issue related to this module

Getting started

From install to your first deployed report
1
Install

Install the module on Odoo 20.0. Administrators receive the Designer group automatically.

2
Open the Designer

Go to Report Builder → Report Designer, search a base model and expand its relations.

3
Create the report

Tick or drag the fields you need, check the live preview, then click Create Report.

4
Deploy

Click Deploy. Find the new report under Report Builder → Reports.

Release Notes
Version 20.0.1.0.0
Initial ReleaseReleased 28 October 2026

What ships in this version:

✓ Visual Designer with live preview, zoom and pan
✓ Field, Computed and Aggregate columns
✓ Live and Stored data modes
✓ Health Check, Excel export and Snapshot Fields
Good to know
Works where you run Odoo

Requirements are deliberately small.

✓ Odoo 20.0 Community and Enterprise
✓ Odoo.sh and on premise installations
✓ Depends only on base and web
✓ No Enterprise, AI/IAP or paid module dependency

Frequently asked questions

Quick answers
Do I need to know SQL or Python?

No. Field paths are chosen from dropdowns or the visual canvas, and computed columns accept simple arithmetic only.

Does it create database views or migrations?

No. A deployed report is a generated read only Odoo model. A Stored report saves its result into its own table, and undeploying removes it.

What is the difference between Live and Stored?

Live reports query on every open and are always current. Stored reports are rebuilt on a schedule (hourly, daily, weekly or manually) and open faster, showing data as of the last refresh.

Can I change a report after deploying it?

Filter, Result Filter, Visible To groups, Menu Location and Automatic Refresh can be changed any time. Base Model, Columns, Language, Company and Data Storage require an Undeploy first.

Can a report change my data?

No. Generated reports are read only end to end.

Can I edit a report in the Designer after creating it on the form?

Yes, with Edit in Designer. The base model cannot be changed there, and a report containing a Computed column must be edited on the classic form.

Which versions are supported?

Odoo 20.0, Community and Enterprise.

Why Ksolves

Need a custom report or a tailored Odoo solution?

Ksolves is an Odoo Gold Partner and CMMI Level 3 certified company. Talk to us about customisation, integration, migration and support.

[email protected]
KsolvesOdoo Gold PartnerCMMI Level 3Odoo

Free 120 Days Support

Get 120 days of FREE support (doubt, queries, & bug fixing) on Odoo
applications from the date of purchase. Enhance the functionality of
your business with the Ksolves Odoo experts.

pic

Get your Personalized Demo

0/50 characters
0/100 characters